Analyzing CoreDNS logs with Clickhouse and Vector
I’ve been toying around Clickhouse and Vector at my day job and find both of these tools pretty interesting at what they do. A short summary for those unaware of these tools:
- Vector helps you build a pipeline for collecting, transforming and processing different kinds of observability data (logs and metrics).
- Clickhouse is a columnar based DB used as a warehousing tool for generating reports and analytics.
Now, for the context, I use coredns on my personal dev machine as it supports Split DNS (routing certain zones to a particular resolver) which I need for accessing internal domains at work. Yep, systemd-resolved can also do this, but I find coredns easier to configure and manage with OpenVPN as well.
Anyway, so one random evening, I got the idea of dumping CoreDNS Logs to Clickhouse. Maaaybe I was still hungover from the Vector/Clickhouse work I was doing at work but nevertheless I was interested in it.
Overview#
- Gather logs from CoreDNS.
- Transform the logs with
regexand construct a payload for Clickhouse. - Write a schema for the logs table.
- Dump to Clickhouse.
Here’s how the pipeline looks:
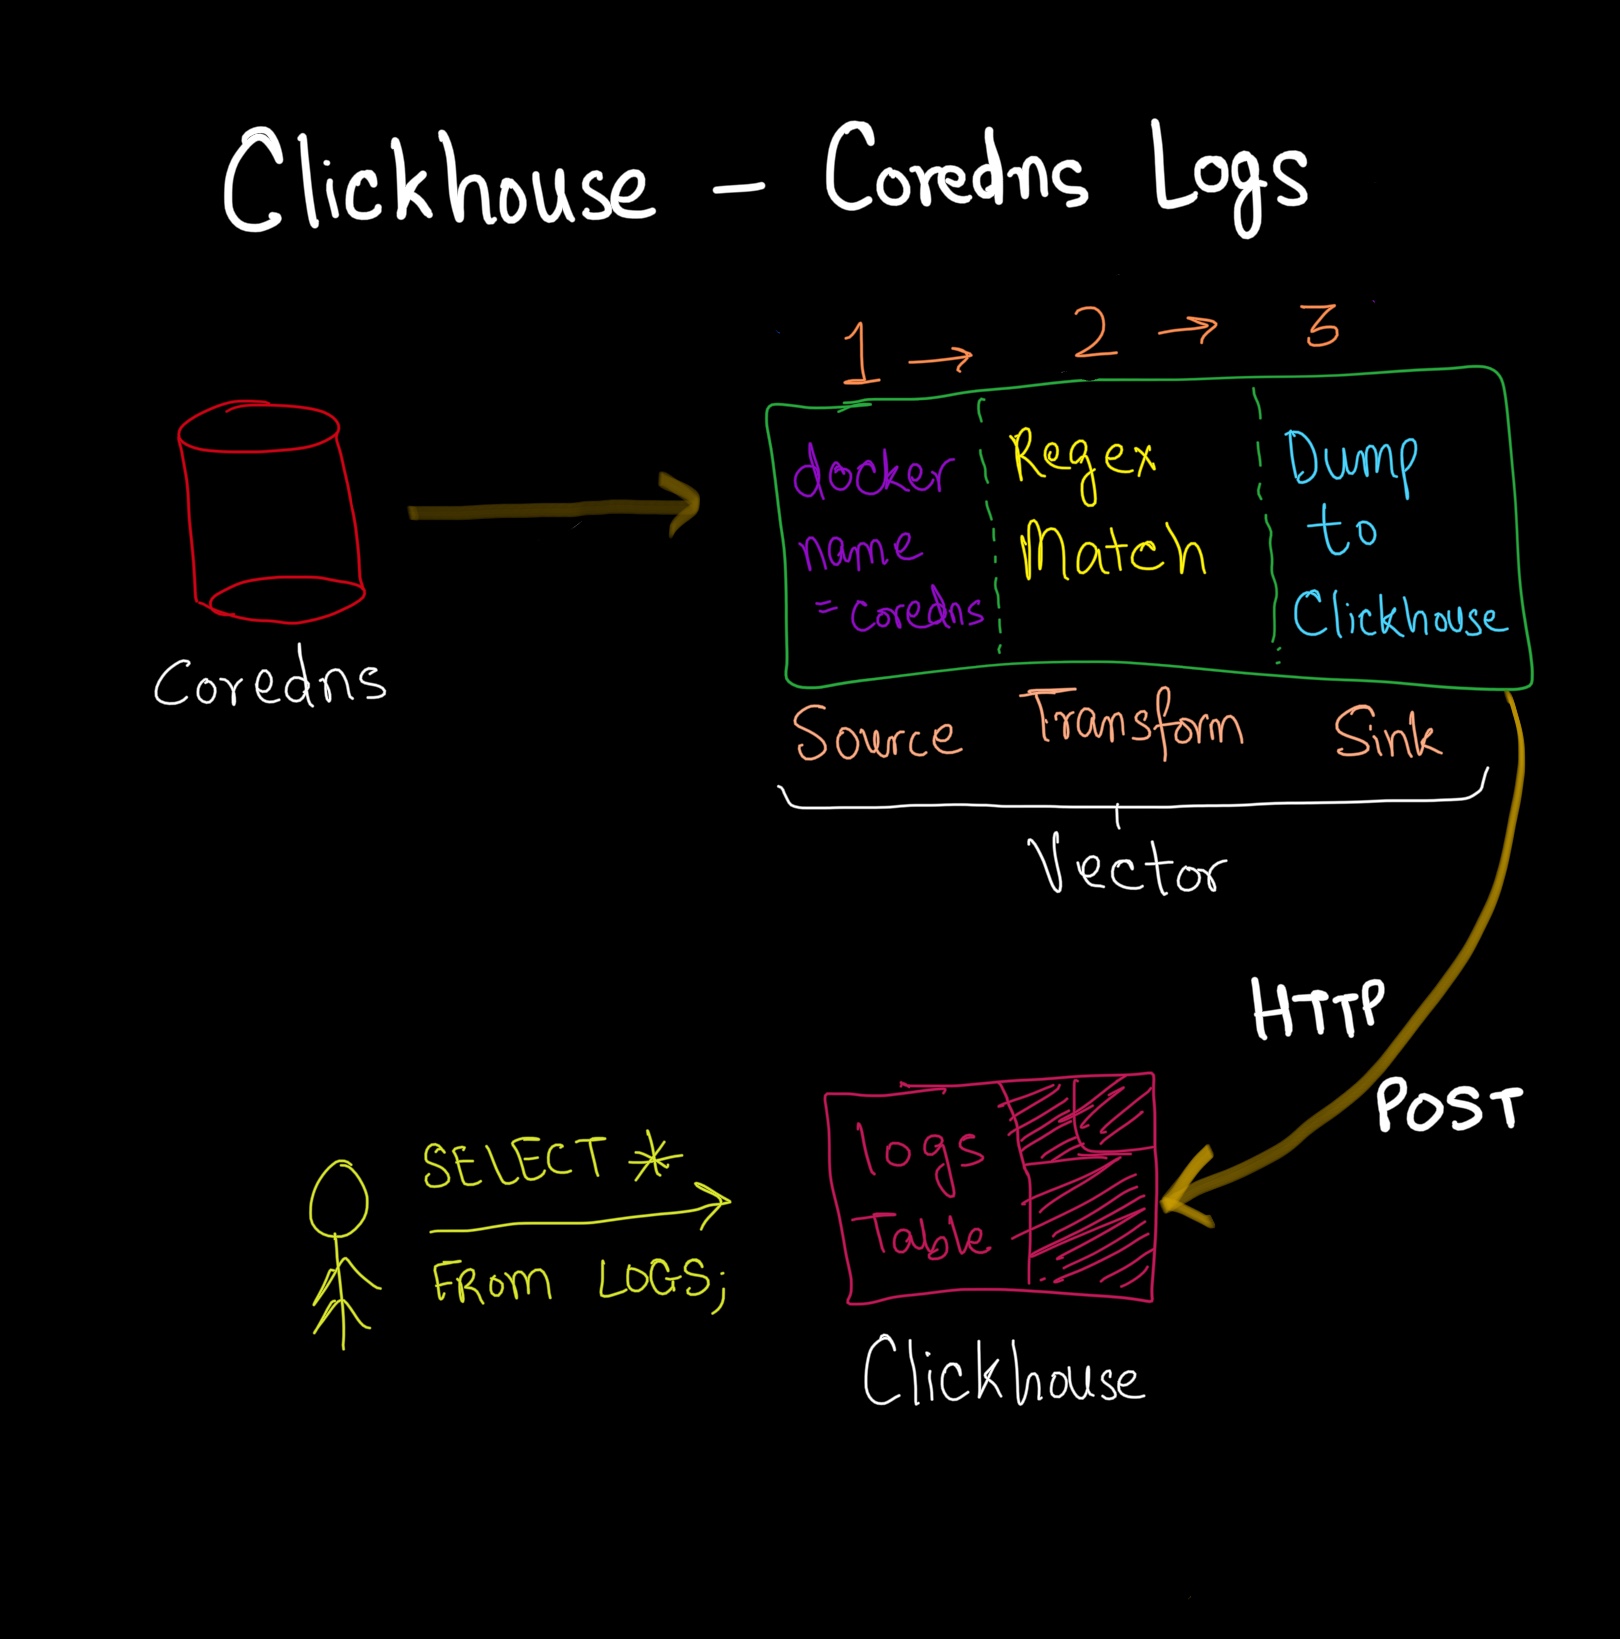
Collecting Logs#
First, let’s look at how the raw logs are structured by CoreDNS:
[INFO] 127.0.0.1:55678 - 21963 "A IN xpui.app.spotify.com. udp 38 false 512" NXDOMAIN qr,rd,ra 121 0.061416978s
[INFO] 127.0.0.1:59333 - 22742 "AAAA IN incoming.telemetry.mozilla.org. udp 48 false 512" NOERROR qr,aa,rd,ra 106 0.049235139s
[INFO] 127.0.0.1:39609 - 47247 "AAAA IN ping.archlinux.org. udp 36 false 512" NOERROR qr,rd,ra 140 0.056721154s
Vector provides a variety of sources to collect these logs. Since I am running coredns as a Docker container, the following config shows how to collect logs from a particular container:
# Filter coredns logs from Docker logs
[sources.coredns_logs]
  type = "docker_logs" # required
  docker_host = "unix:///var/run/docker.sock"
  include_images = ["coredns/coredns"] # optional, no default
The above config basically specifies a Docker Host variable and an image name filter. Vector talks to the Docker API over a unix socket and gathers metadata about the container (like container_created_at, container_name, label etc).
After collecting logs from Vector, it enriches with the following metadata.
{
    "container_created_at": "2021-06-04T14:18:03.967143133Z",
    "container_id": "00c5c4d36ea5b4772b517d3cca7d397c92f72be2a2bf45bb8c430f717fbd331e",
    "container_name": "coredns_coredns_1",
    "host": "iris",
    "image": "coredns/coredns",
    "label": {
        "com.docker.compose.config-hash": "928d71143c2af6553d551dbbf14140304d53f92378746454fbfeb0382a896d5b",
        "com.docker.compose.container-number": "1",
        "com.docker.compose.oneoff": "False",
        "com.docker.compose.project": "coredns",
        "com.docker.compose.project.config_files": "/home/karan/Code/Infra/coredns/hydra-vpn-compose.yml",
        "com.docker.compose.project.working_dir": "/home/karan/Code/Infra/coredns",
        "com.docker.compose.service": "coredns",
        "com.docker.compose.version": "1.29.2"
    },
    "message": "[INFO] 127.0.0.1:38266 - 20341 \"A IN open.spotify.com. udp 34 false 512\" NOERROR qr,rd,ra 160 0.300268123s",
    "source_type": "docker",
    "stream": "stdout",
    "timestamp": "2021-06-04T16:13:07.454601872Z"
}
(NOTE: I am using console sink to dump these logs to STDOUT. It’s pretty handy for inspecting logs).
# Print parsed logs to stdout
[sinks.print]
type = "console"
inputs = ["coredns_logs"]
encoding.codec = "json"
As you can see from the above JSON object, Vector has transformed the log with its own Data Model. The log that we care about now is inside .message key. It’s nice to have other metadata as well.
Transforming the logs#
Our objectives at this step:
- Discard unused fields. We don’t really care about container metadata for this mini-project.
- Parse the
messagefield withregexso they can be stored in individual columns in our Clickhouse table.
Now, CoreDNS can emit two kinds of logs (INFO and ERROR). The error usually happens when the upstream resolver is unreachable or there’s an issue with any of the CoreDNS plugins.
We need to write regex for both cases:
INFOlogs:
\[(?P<level>[^]]+)]\s(?P<server_addr>[^:]+):(?P<server_port>\S+)\s+-\s+(?P<id>\S+)\s+(?P<type>\S+)\s+(?P<class>\S+)\s+(?P<name>\S+)\s+(?P<proto>\S+)\s+(?P<size>\S+)\s+(?P<do>\S+)\s+(?P<bufsize>[^"]+)"\s+(?P<rcode>\S+)\s+(?P<rflags>\S+)\s+(?P<rsize>\S+)\s+(?P<duration>[\d\.]+).*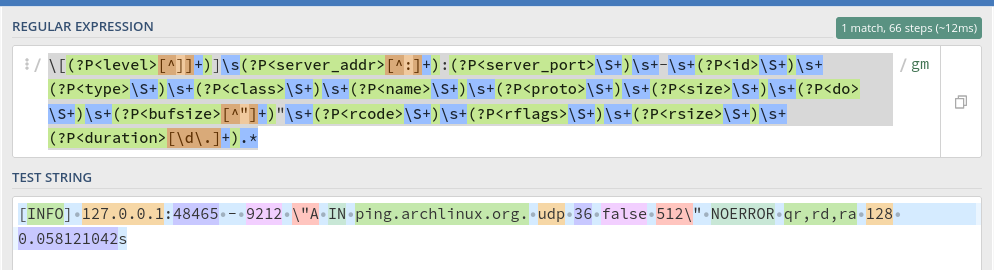
ERRORlogs:
\[(?P<level>ERROR)]\s+(?P<component>plugin\/errors):\s+(?P<code>\S)+\s+(?P<name>\S+)\s+(?P<type>[^:]*):\s+(?P<error_msg>.*)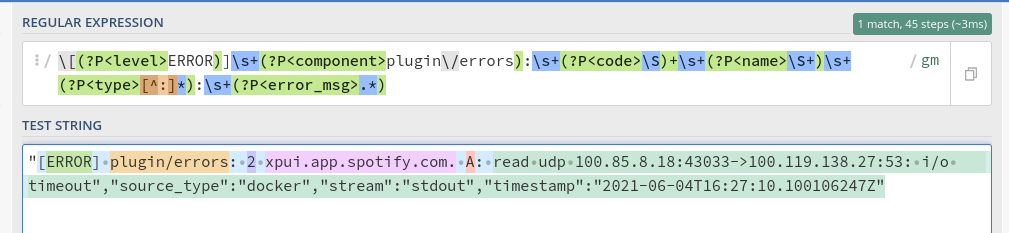
Combining a bunch of other things to remove some fields and constructing the final payload, the config looks like this:
# Parse coredns logs
[transforms.parse_logs]
type = "remap"
inputs = ["coredns_logs"]
source = '''
# parse the log event.
ts = .timestamp
log,err = parse_regex(.message,r'\[(?P<level>[^]]+)]\s(?P<server_addr>[^:]+):(?P<server_port>\S+)\s+-\s+(?P<id>\S+)\s+"(?P<type>\S+)\s+(?P<class>\S+)\s+(?P<name>\S+)\s+(?P<proto>\S+)\s+(?P<size>\S+)\s+(?P<do>\S+)\s+(?P<bufsize>[^"]+)"\s+(?P<rcode>\S+)\s+(?P<rflags>\S+)\s+(?P<rsize>\S+)\s+(?P<duration>[\d\.]+).*')
if err !=null {
    # capture the error log. If the error log also fails to get parsed, the log event is dropped.
  log = parse_regex!(.message,r'\[(?P<level>ERROR)]\s+(?P<component>plugin/errors):\s+(?P<code>\S)+\s+(?P<name>\S+)\s+(?P<type>[^:]*):\s+(?P<error_msg>.*)')
}
. = log
# add timestamp
.timestamp = ts
# remove fields we dont care about
del(.do)
'''
drop_on_error = true
Apart from regex matching, we store the timestamp as received from Vector (since CoreDNS logs don’t contain any timestamp information). We delete some fields that we don’t care about.
Vector uses a powerful DSL (called VRL) to do such kind of transformations on the fly. It has a lot of functions to do almost any kind of transformation to your original event payload. You can invoke vector vrl from the terminal and get a shell to write the above transformations and debug quickly. It proved to be really useful when dealing with such a long regex pattern.
Storing in Clickhouse#
Finally we get to the part where we need to dump these logs to our Clickhouse DB. Here’s the schema for the table where we will be storing these records:
CREATE DATABASE IF NOT EXISTS `coredns`;

CREATE TABLE IF NOT EXISTS `coredns`.`logs` (
    `timestamp` DateTime('Asia/Kolkata'),
    `bufsize` Int32,
    `class` LowCardinality(String),
    `duration` Float64,
    `id` Int32,
    `level` LowCardinality(String),
    `name` String,
    `proto` LowCardinality(String),
    `rcode` LowCardinality(String),
    `rflags` String,
    `server_addr` String,
    `server_port` Int32,
    `rsize` Int32,
    `size`  Int32,
    `type` LowCardinality(String)
) ENGINE = MergeTree()
PARTITION BY toYYYYMM(timestamp)
ORDER BY toYYYYMMDD(timestamp)
TTL timestamp + INTERVAL 1 WEEK;
Key things to note:
LowCardinalityis used for columns where the data is predictable to reduce the disk space used.- Clickhouse uses the sort key as the primary key if unspecified. This is the default behaviour.
- TTL for the records is set to 1 week. After 1 week all the records will be purged. Since this is my dev machine, I don’t really care about a higher TTL.
- This also means that the partition is never really put to use since I am partitioning by month but logs are being deleted every week. At this scale, it doesn’t really make sense to even have it, but I just included it for posterity.
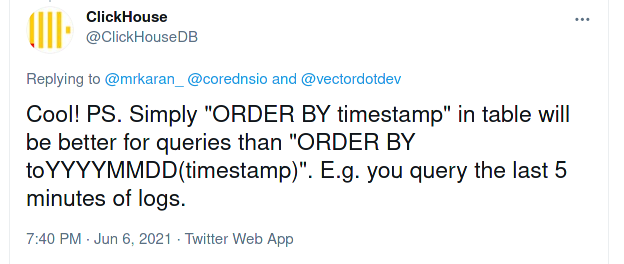
UPDATE:
Clickhouse on Twitter clarified that ORDER BY timestamp will have better performance in this context. Usually if your queries are “last 1h”, “last 5m” based, it is better to not store the the sort key as YYYYMMDD format.
Now, we need to instruct Vector to send these logs to Clickhouse:
[sinks.coredns_logs_clickhouse_output]
  type = "clickhouse"
  inputs = ["parse_logs"]
  compression = "gzip"
  database = "coredns"
  endpoint = "http://localhost:8123"
  table = "logs"
  encoding.timestamp_format = "unix"
  batch.timeout_secs = 10
Clickhouse offers an HTTP API (which is running on port 8123 by default). Vector takes the input from the previous step (parse_logs transformation) and sends it to Clickhouse over the HTTP interface. Clickhouse stores datetimes in UNIX, so before sending the data, Vector can encode certain fields in the payload to a different data type as well (isn’t that cool 😎)
Query Examples#
I’ve been running this pipeline for 3-4 days, so I have a decent amount of data collected to show for the blog post.
-
Total Count of Queries
SELECT count(*) FROM coredns.logs ┌─count()─┐ │ 16774 │ └─────────┘ -
Top Query Types
SELECT count(*) AS total, type FROM coredns.logs GROUP BY type ORDER BY total DESC LIMIT 5 ┌─total─┬─type─┐ │ 9931 │ A │ │ 6852 │ AAAA │ └───────┴──────┘ -
Top Query Names
SELECT count(*) AS total, name FROM coredns.logs GROUP BY name ORDER BY total DESC LIMIT 5 ┌─total─┬─name────────────────────────────┐ │ 2513 │ ping.archlinux.org. │ │ 1868 │ ws.todoist.com. │ │ 1011 │ incoming.telemetry.mozilla.org. │ │ 802 │ vortex.data.microsoft.com. │ │ 707 │ logs-01.loggly.com. │ └───────┴─────────────────────────────────┘ -
Max/Min duration
SELECT max(duration) AS max, min(duration) AS min FROM coredns.logs FORMAT Vertical Row 1: ────── max: 4.056606352 min: 0.000020837 -
Top TLDs Queried
SELECT
    count(name) AS total,
    topLevelDomain(substring(name, 1, -1)) AS tld
FROM coredns.logs
GROUP BY tld
ORDER BY total DESC
LIMIT 10

┌─total─┬─tld──┐
│ 10666 │ com  │
│  3950 │ org  │
│   671 │ net  │
│   346 │ so   │
│   288 │ tech │
│   279 │ io   │
│   190 │ co   │
│   167 │ dev  │
│    82 │ arpa │
│    43 │ in   │
└───────┴──────┘
Well, that’s all I could think of really. If you’ve some more interesting analysis to get from this data, let me know!
Summary#
The intention behind writing this post is to give an overview of how the entire log collection and processing pipeline works. Using Vector has been an amazing experience however the sad bit is that I don’t know Rust and I cannot contribute to some of the issues I’ve opened (even though they are presumably trivial). Maybe I should pick up Rust, finally? 🤭
Thanks for reading!