Adding Prometheus configuration to your CI/CD workflow
Prometheus configurations can turn into a mess in no time if you have a lot of different jobs scraping different targets. Certainly you can use tools like jsonnet to keep your YAML files DRY but this post is not about that. I initially started off by writing one job to scrape a set of EC2 instances in a particular AWS VPC. Over the time, I had a requirement to do it over 3-4 different targets, each of them had their own rules and different type of exporters as well. The whole practice of SSHing into the server, opening the config file in vim and editing in the server didn’t just feel right. No surpises for guessing that I f*cked up a few times with config errors (YAML sigh) and finally decided that I need a better solution for this.
CI/CD for config files#
“Wait, so now you’re telling me that I need to setup a full fledged pipeline just for a few config files?”, must have been the thought that echo’ed in your head. Before you jump to the conclusion that it’s overdoing things, IMHO it’s not. And it’s not that difficult either to set it up, so why not? After integrating CI in your workflow, you can be confident that no bad syntax in your PromQL queries or in general the YAML syntax would break your monitoring system.
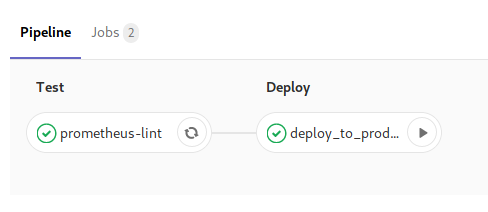
“That sounds amazing, show me teh code already”. Our Pipeline is fairly fairly simple:
- Lint the code using promtool.
- Push to S3
- Write a shell script to pull from S3, put the config in right places and restarts Prometheus systemd service

You can automate the last step too, but I just wanted to keep atleast one manual check in this system so I decided against it. And since I don’t have a distributed Prometheus setup yet, it’s simple to keep things the old school way here .
You can do pretty much all of the steps in the above pipeline of any CI of your choice, but I am using Gitlab, so here’s a sample .gitlab-ci.yml file:
stages:
  - lint
  - deploy

prometheus-lint:
  stage: lint # run this job on stage lint
  image: golang:1.11-alpine # pull go1.11 image from official docker repo
  before_script:
    - apk update && apk add git # install git
  script:
    - GOOS=linux GOARCH=amd64 CGO_ENABLED=0 go get -u github.com/prometheus/prometheus/cmd/promtool # fetches promtool package
    - $GOPATH/bin/promtool check rules rules/alerts/* # run the `check rules` command for my prometheus rule files

push-to-s3:
  stage: deploy # run this job on stage deploy
  environment:
    name: production # tag the job metadata in this environment. useful to quickly revert deploys when shit hits the fan
  image: python:3.7-alpine
  script:
    - pip install awscli # adds aws cli tools
    - aws s3 sync prometheus/rules s3://mybucket/rules/ # pushes our rule config files to s3
  only:
    refs: # only allow deploy if branch is master.
      - master
  when: manual # trigger this job manually
A brief explanation for the above file:
- stages: Used to define multiple stages in our pipeline and they are executed in order.
- jobs:
prometheus-lintis one job which will be run in the stagelint. I am using Docker executor with Gitlab runner, so the runner agent talks to the docker executor. Gitlab-CI file is basically an API abstracted to hide away these details from the end user so all the CI/CD files look pretty much the same but behind the scenes the way they are executed totally depends on the executor you choose. Since we are using Docker executor, theimagetag is picked up and the same docker image is pulled from a public docker repo for this job. before_scriptis basically an event which is called before we begin running our actual CI stuff. You can add your project dependencies here.scriptis a list of commands to be executed inside your environment (container for us).
Now that we have our basics about the CI/CD pipeline in place, let us see what each of the jobs is actually doing:
-
prometheus-lint: Installspromtoolbinary and runs it against ourrules/folder. The default working directory is our repository itself, so we didn’t have to give the absolute path. -
push-to-s3: Installsawscli tools, so we can push the files to s3. In case you are wondering where are the access key and secret key present, I have added them as protected variables in my project settings, so only the protected branches (egmaster) can access them.

Automate everything? Nah mate#
This is how the deploy.sh script looks like:
#!/bin/sh
aws s3 sync s3://mybucket/rules/ /etc/prometheus/config/rules/
promtool check config /etc/prometheus/prometheus.yml
sudo service prometheus restart
As much as I’d like to be a cool hipster and run /deploy from my slack bot (last I checked, there’s a legit term for this: ChatOps), I simply don’t prefer that. Having a human intervention before doing critical deployments like this is OK, IMHO. I don’t update the Prometheus config often, so I don’t mind actually SSH-ing into the single instance and triggering a shell script which does the job for me. I also don’t have a distributed Prometheus setup as of yet. Things will definitely change based on your requirements and there’s no one size that fits all.
I’m much more confident now with my config changes and don’t have to pray to the server overlords everytime I restart Prometheus.
It just works .