Building an LLM-Assisted Incident Investigation Tool
When you are debugging a production incident, you are forming hypotheses, testing them against evidence, ruling things out, trying not to confuse correlation with causation, and making triage calls under time pressure. The hard part is the reasoning – figuring out why the system is misbehaving, deciding what to stabilize first, knowing when to stop chasing a red herring.
But a surprising amount of the time is not spent reasoning. It is spent gathering evidence.
You are flipping between your metrics dashboard, log viewer, scheduler, cloud console, SSH sessions, deployment history, and a half-written scratchpad. You are trying to answer questions that are conceptually simple but operationally expensive:
- What changed in the last hour?
- Did the error spike start before or after the deploy?
- Is this one sick node or a fleet-wide regression?
- Did the autoscaling event line up with the HAProxy alert?
- Are we looking at cause, effect, or a noisy side symptom?
Each question requires pulling data from a different tool, in a different format, often with timestamps in different timezones. Then you stitch them into a timeline before you can even begin hypothesizing.
That evidence-gathering phase is where LLMs turned out to be useful for me. Not because they “solve incidents” – the hypothesis formation, the triage, the mitigation calls stay human. But an LLM with access to the right CLIs can chew through the data-gathering faster than I can by hand.
I took the system I’d been building internally and rebuilt it as a package for Pi – a minimal, extensible terminal coding agent – called pi-sre-mode. This post is about the journey from a custom agent platform to a thin extension, and why the value turned out to live in content, not code.
The Predecessor: llmduck#
Before pi-sre-mode, I had a system called llmduck. It went through several rewrites – first in Go, then partially in Rust, and finally as a full TypeScript web application with a server (LLM orchestration, session persistence, WebSocket dispatch), a remote agent (command execution on production hosts with policy enforcement), and a React frontend with a split-panel investigation UI.
The agent had one tool: bash. All infrastructure interaction happened through CLIs – metrics, logs, scheduler state, cloud APIs, SSH. The LLM decided what to run, the agent executed it, and the server tracked the conversation. An SRE methodology skill guided the model through a structured investigation loop: triage, scope, gather evidence across metrics/logs/scheduling, correlate, conclude.
It worked. Give the model good operational guidance and read-only access to the right CLIs, and it can do a lot of the mechanical data gathering that normally burns 20-40 minutes during an incident. It can compare scheduler restarts with metric trends. It can correlate a failing backend with a cloud autoscaling event. It can notice that one host is missing metrics entirely and that the “healthy” cluster is only healthy because the remaining nodes are absorbing the load.
But the runtime was increasingly the wrong abstraction.
I had a custom server, a custom agent, a custom frontend, custom registries for skills and templates, custom session persistence, and a CI pipeline to build and deploy it all. The upstream/wrapper two-repo design – where the generic product lived on GitHub and the org-specific overlay was rsynced into it during build – still meant I was maintaining a bespoke investigation platform.
The more I worked on it, the more obvious it became: the content was the product. The runtime was plumbing.
The skills, the prompts, the methodology, the failure pattern library, the runbooks, the templates – that was where the value lived. Everything else was infrastructure I was maintaining just to get those skills into an LLM session.
Why Pi#
I did not want another chat app. I wanted the investigation to live where I already work: in the terminal, next to the real tools. Pi gave me that, and the specific SDK primitives it exposes turned out to map almost 1:1 to what I had been building by hand in llmduck.
A session looks like this:
/check-connectors
/incident
investigate elevated p99 latency for payments-api, start with a timeline
/report
/incident is an interactive wizard – pick a template, name the service, set a time window.
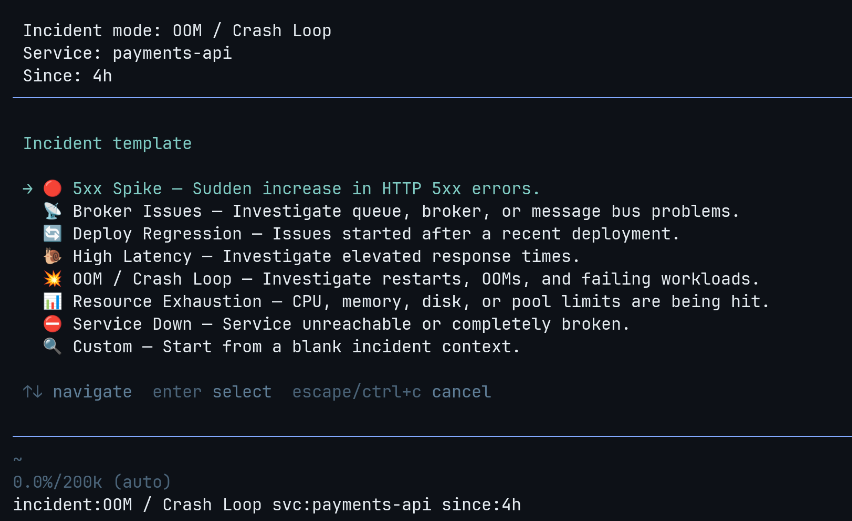
/check-connectors– verifies your infrastructure CLIs are reachable/report– generates a structured postmortem from the investigation/sudo– temporarily bypasses the read-only guardrails
How It Works#
Pi extensions are TypeScript modules that receive an ExtensionAPI object – hooks into the agent lifecycle, slash commands, session state, shell execution, UI primitives, and an inter-extension event bus. The whole extension is one file and the rest is markdown.
The SDK has a few primitives that matter here:
Carrying context across the conversation#
The before_agent_start hook fires before every agent turn. The extension builds a context block from the current incident state and appends it to the system prompt:
pi.on("before_agent_start", (event) => {
  return { systemPrompt: `${event.systemPrompt}\n\n${incidentContext}` };
});
Template, service name, time window, guardrail posture, overlay guidance, preferred skills – all injected automatically. You do not need to keep re-explaining “payments API, last 2 hours, high latency, read-only.” It follows you.
Blocking mutations before they execute#
The tool_call hook intercepts every tool invocation before execution:
pi.on("tool_call", async (event) => {
  const reason = getGuardrailBlockReason(event.toolName, event.input);
  if (reason) return { block: true, reason };
});
The guardrail implementation is regex-based with token boundary detection:
const BLOCKED_PATTERNS = [
  { pattern: /sudo/, reason: "sudo blocked" },
  { pattern: /rm/, reason: "file deletion blocked" },
  { pattern: /kill|pkill|killall/, reason: "process termination blocked" },
  { pattern: /bash\s+-c|sh\s+-c|zsh\s+-c/, reason: "shell trampoline blocked" },
  { pattern: /eval/, reason: "eval blocked" },
  { pattern: /\$\(/, reason: "subshell blocked" },
  { pattern: /systemctl\s+(restart|stop|start)/, reason: "systemctl mutation blocked" },
  { pattern: /aws\s+.*\s+(create|delete|update|put|run|start|stop|terminate|reboot)/,
    reason: "AWS mutation blocked" },
];
The token boundary prevents false positives – remove does not match the rm rule. The write and edit tools are unconditionally blocked. /sudo disables this when needed.
Persisting incident state#
Pi sessions are tree-structured – you can fork, navigate branches, switch contexts. Incident state is persisted as append-only entries:
pi.appendEntry<IncidentModeState>("incident-mode-state", state);The extension hooks into session_tree and session_fork events to carry incident state across branches automatically. If you fork to explore a side hypothesis, the incident context comes with you.
Commands and UI#
pi.registerCommand() handles slash commands. The /incident wizard uses ctx.ui.select() and ctx.ui.input() for interactive setup – template selection, service name, time window. pi.exec() runs shell commands for connector checks.
Inter-extension events#
Pi has an in-process event bus (pi.events) for cross-package communication – same JS runtime, no network, just pub/sub between extensions loaded from different npm packages. The base package subscribes to a channel, the overlay emits to it at session start. The decoupling is at the import level, not the process level. More on this below.
Templates and Skills#
Most incidents fall into a handful of patterns – 5xx spike, high latency, OOM crash loop, deploy regression, service down. Each pattern has a different starting point: for latency you want percentile breakdowns and dependency response times first; for OOMs you want restart history and memory growth; for a deploy regression you want a before/after comparison.
Templates encode that. When you pick “High Latency” in the /incident wizard, the system prompt gets a focused directive: check p50/p95/p99, look for saturation signals, check upstream dependencies, identify whether queueing is involved. The model starts in the right place instead of flailing. You can also skip the wizard entirely – /incident-5xx payments-api last 2h sets up the investigation directly.
The investigation methodology itself lives in skills – markdown files that get loaded into context:
---
name: sre-methodology
allowed-tools: [Read, Bash, Grep]
---

## Core Loop

1. **Observe**: Gather data. Metrics, logs, scheduler state.
2. **Hypothesize**: Form a theory from the evidence.
3. **Test**: Run a specific query that would confirm or disprove.
4. **Evaluate**: Did the evidence match? Adjust and repeat.
The base package includes two skills: an observe-hypothesize-test-evaluate loop with first principles (evidence over speculation, build timeline before concluding, the loudest symptom is often downstream), and a concrete investigation playbook (scope the blast radius, check recent changes, follow the service path from edge to dependency, narrow using the template focus).
Without the methodology, the model tends to jump to conclusions or fixate on the noisiest symptom. With it, investigations are more systematic.
The Overlay System#
The public package is intentionally generic. The real leverage comes from overlays – private Pi packages that layer org-specific knowledge on top.
An overlay is a separate Pi package that emits an event at session start. The base package picks it up and merges it into the active configuration – templates, connector checks, skills, timezone hints, report output paths:
export default function myOrgOverlay(pi: ExtensionAPI) {
  const overlay: IncidentOverlay = {
    id: "my-org",
    priority: 100,
    timezoneHint: "IST (UTC+5:30); metrics are UTC, logs are IST.",
    reportPathPattern: "rca/{{date}}-{{slug}}.md",
    defaultSkills: ["org-sre-methodology"],
    promptPreamble: "Use org service topology, strict timezone handling...",
    connectorChecks: [ /* ... */ ],
    templates: [ /* ... */ ],
  };

  pi.on("session_start", () => {
    pi.emit("incident-mode:register-overlay", overlay);
  });
}
Templates merge by ID (overlay wins). Skills are deduplicated. Prompt preambles stack across overlays.
What an Overlay Adds#
At work, my private overlay adds investigation templates tied to specific services and a few thousand lines of operational knowledge as skills – how to query our metrics stack, how to read our logs, how to interpret scheduler state, and how to write the postmortem.
The interesting part is what those skills encode. Not just CLI syntax, but the gotchas you learn the hard way: timezone mismatches between tools, CPU metrics that mean something different depending on allocation config, log columns that don’t exist where you’d expect them, query patterns that accidentally match unrelated data. A failure pattern library teaches the model to recognize cascading failures, throughput cliffs (silence often means blocked, not recovered), and the difference between a root cause and a downstream symptom.
This is the kind of institutional knowledge that normally lives in someone’s head or a stale wiki page. Encoding it as skills means it gets applied consistently during every investigation.
Every team has different tools, naming conventions, auth assumptions, and definitions of “normal.” Mix that into the base package and you either leak private knowledge or make the tool unusably abstract. The overlay keeps them cleanly separated.
What the LLM Is Actually Good At#
This is not an “AI will run your ops team” post. The model does not do triage or make mitigation calls. What it does well is the stuff that eats wall-clock time:
Gathering and cross-referencing evidence#
The model does not stop at “good enough.” If you ask it to investigate a latency spike, it will check p50/p95/p99, break it down per node, compare against the pre-deploy baseline, look at upstream dependency latency, check if the error rate moved with it, and then go look at logs for the time window where the percentiles diverged.
Building timelines from messy evidence#
The model is good at stitching together outputs from different tools – logs in IST, metrics in UTC, a deploy at some offset, a scheduler restart in the middle, a cloud instance termination, a queue backup two minutes later – into a coherent narrative. It can produce a first-pass timeline like “memory growth started after deploy X, restart happened 14 minutes later, error rate rose only on one node, autoscaling replaced the sick instance, and downstream proxy alerts were a secondary symptom” faster than I can by hand.
Producing a first draft of the postmortem#
The postmortem is hardest to write right after the incident, precisely when it is most valuable. If the investigation happened inside Pi, /report turns the conversation into a structured markdown RCA draft immediately – timeline, 5 Whys, impact, action items. That alone saves a lot of the “I’ll write the postmortem tomorrow” drift.
Keeping the investigation disciplined#
The methodology skills help the model stay in evidence-first mode: observe before hypothesizing, build a timeline before concluding, distinguish cause from effect, state uncertainty explicitly, say when a connector is missing instead of guessing. Without this, the model tends to fixate on the noisiest symptom. With it, investigations follow an observe-hypothesize-test-evaluate loop.
Where It Still Fails#
Guardrails are not a sandbox#
The read-only protections are operational guardrails, not security boundaries. They catch accidental mutations during investigation, but they are regex patterns – not a sandbox. The real defense is least-privilege at the infrastructure level: an AWS IAM role scoped to read-only, a metrics API token without write access, an SSH key that can only reach jump hosts. If the credentials the agent has cannot mutate anything, it does not matter if a guardrail regex gets bypassed.
The model can still hallucinate#
It will sometimes invent a metric name, over-index on a noisy symptom, or keep running commands when the evidence is already sufficient. Good skills help but do not make it reliable enough to trust unattended.
The Bigger Lesson#
I spent weeks building and rebuilding a custom agent platform. Rewrote it twice in different languages. All plumbing. The things that actually made the investigations good were:
- the SRE methodology skill that encoded how to think about incidents
- the failure pattern library that taught the model to recognize cascade failures and throughput cliffs
- the per-tool skills that encoded gotchas like “that CPU metric means something different in a cgroup” and “silence in the logs means blocked, not recovered”
- the templates that seeded the investigation direction
- the guardrails that kept the model from accidentally mutating production
All of those are markdown files and a few dozen regex patterns. I kept building runtime to deliver content. Once I had a platform that could host markdown skills and intercept tool calls, the custom stack had no reason to exist.
The code is at github.com/mr-karan/pi-sre-mode.
Fin!