Logging on Nomad with Vector
Application orchestrators like Nomad, Kubernetes etc., allow you to deploy multiple applications on the same host. Logs are stored on the underlying node wherever the applications are run. However, it’s pretty common to treat these instances as ephemeral if they’re a part of an autoscaling group. Therefore depending on the node’s availability to search these logs is not a practical idea as the node can go down anytime. Moreover, in most cases, access to these nodes is limited to cluster administrators, not the maintainers (developers/application owners). In such cases, a log shipping agent must ship and aggregate logs from all cluster nodes and store them centrally (like Elasticsearch, Clickhouse, Loki).
I’d recommend reading this excellent post by Adrian, who has explained how to set up a Vector logging pipeline for applications running with docker task driver and ship the logs to Loki. For the applications running using docker task driver, Nomad piggybacks to docker daemon for configuring logging options. Docker daemon supports many logging options; in my experience, the journald log driver works reliably well.
However, this post is about tasks not using docker but any other driver (e.g. raw_exec and exec). Nomad doesn’t provide many configuration options for logging for these drivers. The biggest issue is that Nomad logs the application’s stdio/stderr stream to the log directory as-is without annotating any metadata about the task. This means that if you’ve multiple applications running on one host, the log shipping agent will not be able to identify which application’s logs are being ingested.
Consider this as an example. We’re running a simple web server using exec driver:
job "http" {
  datacenters = ["dc1"]
  type        = "service"

  group "app" {
    count = 1
    network {
      mode = "bridge"
      port "python-http" {
        to = "8888"
      }
    }

    task "server" {
      driver = "exec"

      config {
        command = "/usr/bin/python3"
        args    = ["-m", "http.server", "8888"]
      }
    }
  }
}
Once the alloc is running, we can find its IP address using:
nomad alloc status 1d05d64b | grep -A 3 'Allocation Addresses'
Allocation Addresses (mode = "bridge")
Label         Dynamic  Address
*python-http  yes      192.168.29.76:31775 -> 8888
On sending an HTTP request using cURL we can see the logs that this webserver generated:
curl -i 192.168.29.76:31775
HTTP/1.0 200 OK
Server: SimpleHTTP/0.6 Python/3.10.4
Date: Sun, 04 Sep 2022 06:18:45 GMT
Content-type: text/html; charset=utf-8
Content-Length: 869
...
Nomad stores the logs inside the applications’ allocation directory, inside /opt/nomad/data/alloc. To see the logs for the above allocation ID, we can use:
tail -f /opt/nomad/data/alloc/1d05d64b-4b59-3c65-8261-760499d9e4f6/alloc/logs/server.stderr.0tail -f server.stderr.0
192.168.29.76 - - [04/Sep/2022 11:48:26] "GET / HTTP/1.1" 200 -
192.168.29.76 - - [04/Sep/2022 11:48:45] "GET / HTTP/1.1" 200 -
Enriching logs with metadata#
As you can see, these logs are precisely what the python3 -m http.server command generates. Ideally, Nomad should have enriched these logs with metadata about the allocation ID, job name, namespace, the node it’s running on, etc., as noted in this GitHub issue.
However, since that’s not yet available, I brainstormed a few different options:
Approach 1: Sidecar#
The first approach was to run vector as a sidecar next to the main task. This is the simplest option, to begin with. Vector can be independently configured to add metadata for the logs collected from the allocation directory of the group. However, as with every sidecar deployment, there’s a lot of extra resource usage. For every 10 different groups, reserving resources for 10 vector agents quickly eats up your available CPU/Memory of the underlying node. A more critical downside, though, was asking every developer to also configure a Vector sidecar job. And to keep all these configs in sync to ensure they’re unified across namespaces is also another headache. Due to these reasons, I discarded this option early on. However, suppose your deployment scale (managing applications) is relatively smaller. In that case, this is actually not a bad idea.
Approach 2: Events Stream#
My next option was to listen to the Nomad events stream and generate a “vector” configuration template to collect logs and enrich them with metadata from the Events Stream. I developed v0.1 of nomad-vector-logger based on this concept. Since I’ve written a wrapper to collect events from Nomad using nomad-events-sink it was relatively straightforward to extend it to generate a vector.toml config. However, after testing in prod for a few days, I noticed that relying on the events stream is unreliable. Nomad events are not WebSocket based (as of yet). It’s a simple long polling mechanism which sends events to a Go channel as and when they happen. What happens when you miss an event? What happens when you run nomad system gc, which clears the events index? These were some of the challenges I faced with this v0.1 approach. There needs to be some sort of “reconcile” mechanism that periodically runs. A reconciliation loop that lists all allocations using the HTTP API can help whenever there are missing events.
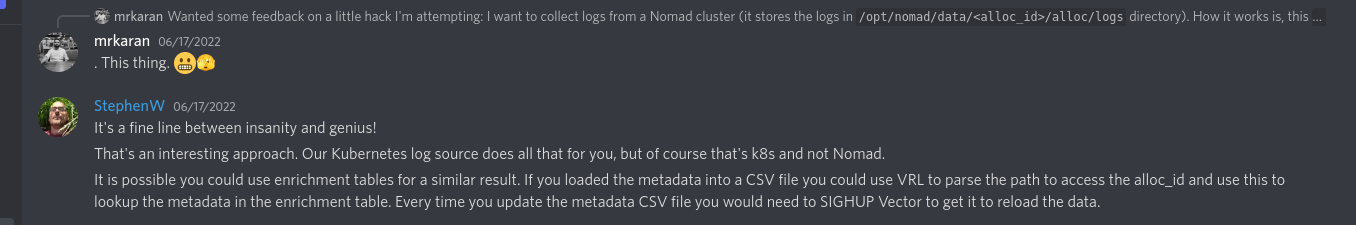
Approach 3: Enrichment Tables#
I also posted about the above program in Vector’s discord group (they’re super active+helpful folks) and discussed this daemon with them. They also suggested a simpler alternative: generating a CSV of running allocations instead of a .toml config. Vector has support for Enrichment Tables which means that it can “lookup” a CSV file to find a particular row and enrich the log event with the information found from the CSV. This seemed a super cool idea, and I developed v0.2 using this. Super thankful to Vector maintainers for giving me this idea!
However, this approach had a few “subtle” drawbacks that I found:
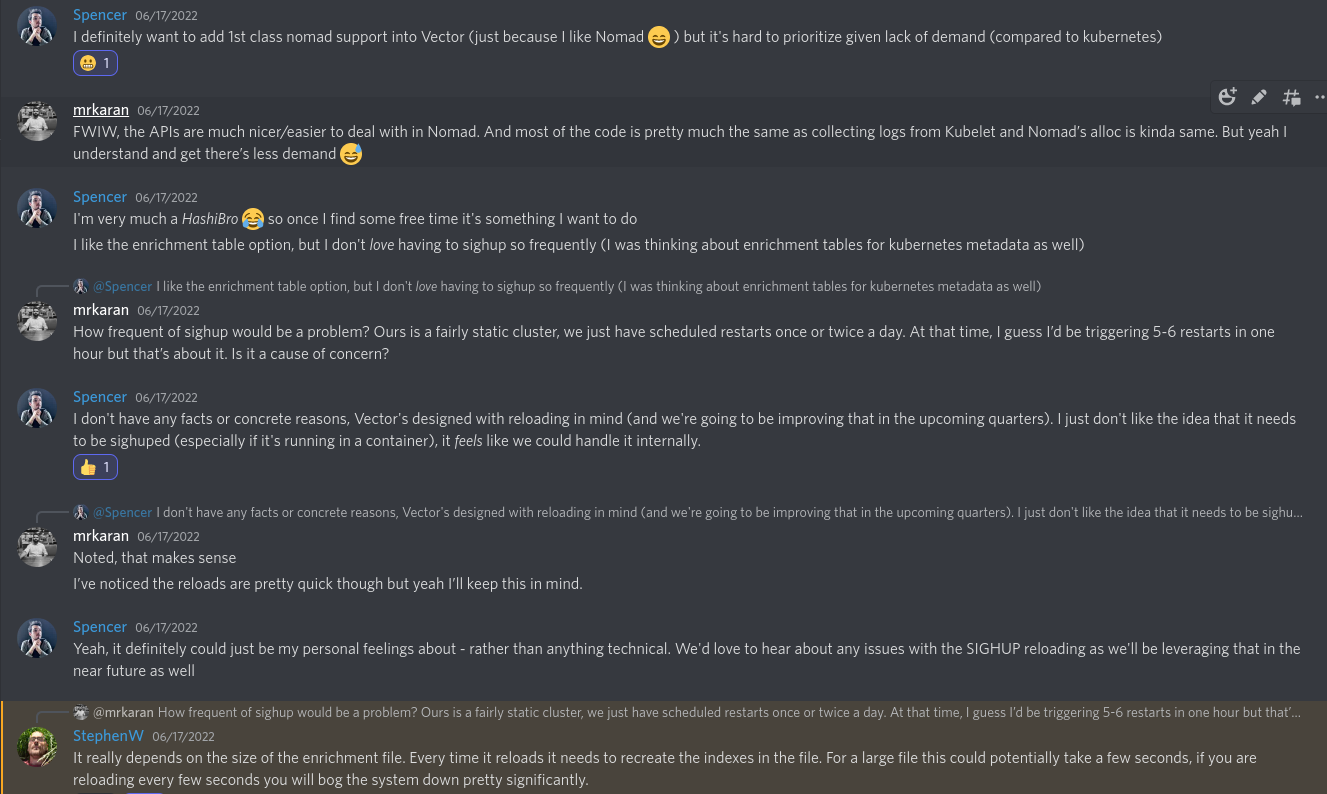
vectordoesn’t support live-reloading if the CSV file changes.vectorhas support for watching a config file for changes or sending aSIGHUPto reload. However, that only works for vector’s own config files. Since the CSV file is an external file, vector cannot watch it for changes. I came up with an ugly bash script hack and compared themd5hash of the file in awhileloop and if it changed, then send aSIGHUPto vector. All I can say is it’s ugly, but it works. If you wish to see it, it’s available here in all it’s glory.- The most significant issue was the chance of losing logs for the initial 10-20s of a new allocation. The above shell script had a
sleep(10)becausemd5sumcan be a bit CPU intensive to keep frequently doing. Vector sees a new allocation and starts ingesting events. It tries to look up the CSV row by the allocation ID, but it doesn’t find it yet in the CSV file, complains about it, and drops the log event. Thus, I had to drop the CSV idea in search to find another more reliable approach to this. For people interested in this approach, you can checkout thecsvbranch here.
Approach 4: Periodic Reconciliation Loop#
The final v0.3.0 solution, which IMHO fixed all the above issues, was:
- Skip Nomad events stream. Since I have to build a reconciliation loop anyway, listening to events is just extra work without tangible benefits.
- I used a background Goroutine channel to periodically refresh the list of allocations running on that node. Even if I fetched this list once every 30s or so, it’s OK because Vector will start ingesting logs once the config gets generated. It will start reading the file from the beginning. So logs aren’t lost even if I templated the config much later after the alloc began running.
- I added the support to delay the removal of allocation from the file. If an allocation is stopped (e.g., a new version is deployed or the job restarted), the program doesn’t immediately removes the allocation from the config file. The user can set a delay period which works like a cooling down period. In this period, one can assume that Vector would have finished sending all logs to the upstream. In case the application generates too many logs faster than what the upstream sink can accept (e.g. if the upstream Elasticsearch gets slower). Suppose we remove the allocation _immediately whenever it stops. In that case, there’s a probability that Vector wouldn’t have read the file to the end. This cooling period helps to ensure that doesn’t happen. This is not a fool-proof situation but should cover most cases unless the upstream sink is dead for many hours.
How it works#
Now that we’ve covered a few different approaches and the pros/cons of each let’s see how nomad-vector-logger works. Essentially nomad-vector-logger is meant to be deployed inside a Nomad cluster as a system job. A system job in Nomad runs on each node. Whenever a new node gets added to the cluster, Nomad’s scheduler schedules a copy of this program on that new node automatically. This is the equivalent of a “Daemonset” in K8s.
nomad-vector-logger uses Nomad’s HTTP API to query all nodes’ running allocations. Once it gets the list, it adds it to an internal map and signals to generate a config.
The final config that is templated out looks like this:
[sources.source_nomad_alloc_64a2f9fd-e003-0bb3-b5cd-838125283a06_proxy]
type = "file"
include = [ "/opt/nomad/data/alloc/64a2f9fd-e003-0bb3-b5cd-838125283a06/alloc/logs/proxy*" ]
line_delimiter = "\n"
read_from = "beginning"

[transforms.transform_nomad_alloc_64a2f9fd-e003-0bb3-b5cd-838125283a06_proxy]
type = "remap"
inputs = ["source_nomad_alloc_64a2f9fd-e003-0bb3-b5cd-838125283a06_proxy"]
source = '''
# Store Nomad metadata.
.nomad.namespace = "default"
.nomad.node_name = "pop-os"
.nomad.job_name = "nginx"
.nomad.group_name = "nginx"
.nomad.task_name = "proxy"
.nomad.alloc_id = "64a2f9fd-e003-0bb3-b5cd-838125283a06"
'''
For people unfamiliar with vector, it’s essentially doing 2 things:
- Get logs from a “file” source. The file path comes from
nomad-vector-logger(where all the logs forproxytask are located) - It adds a JSON object
nomadwith relevant keys.
Vector pipeline will send this event to another “transformer” which can further process the log event (for eg parsing it as logfmt or JSON etc) and then finally send it to an upstream sink like Loki/Elasticsearch etc.
Here’s an example of the before/after of a log line shown above in this post:
Before#
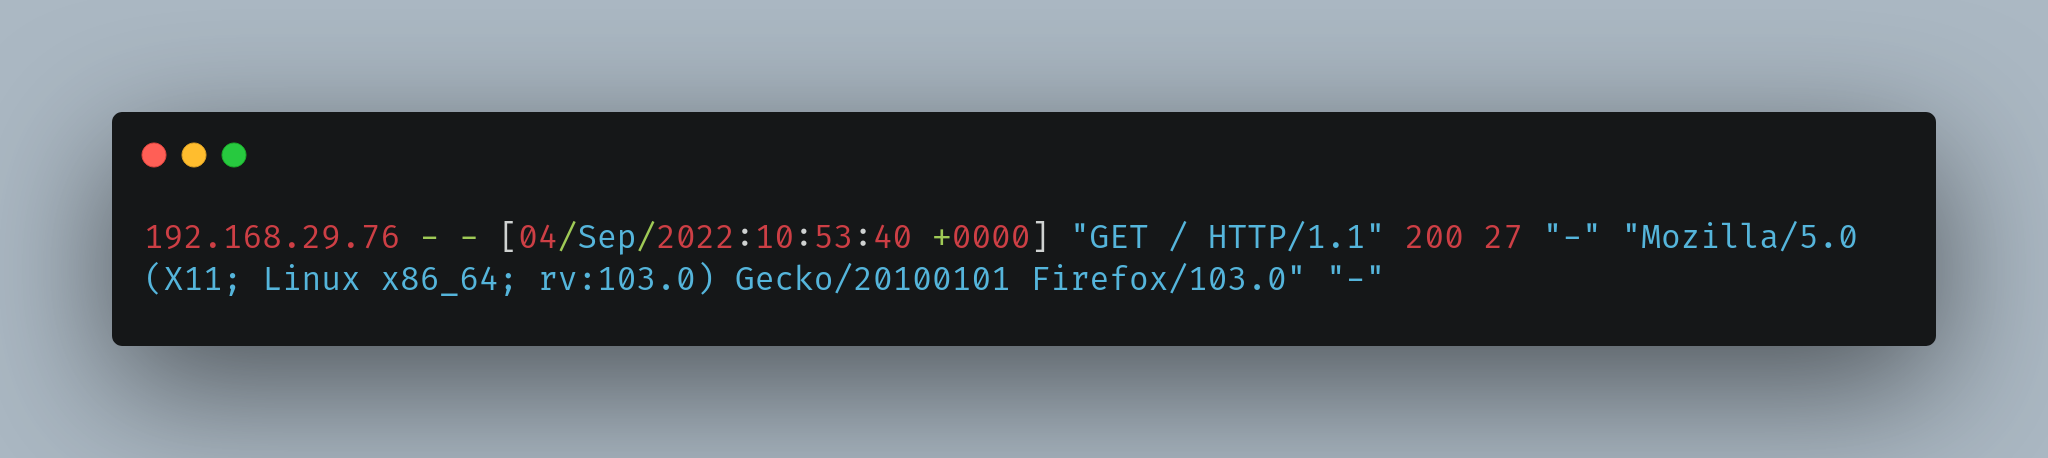
After#
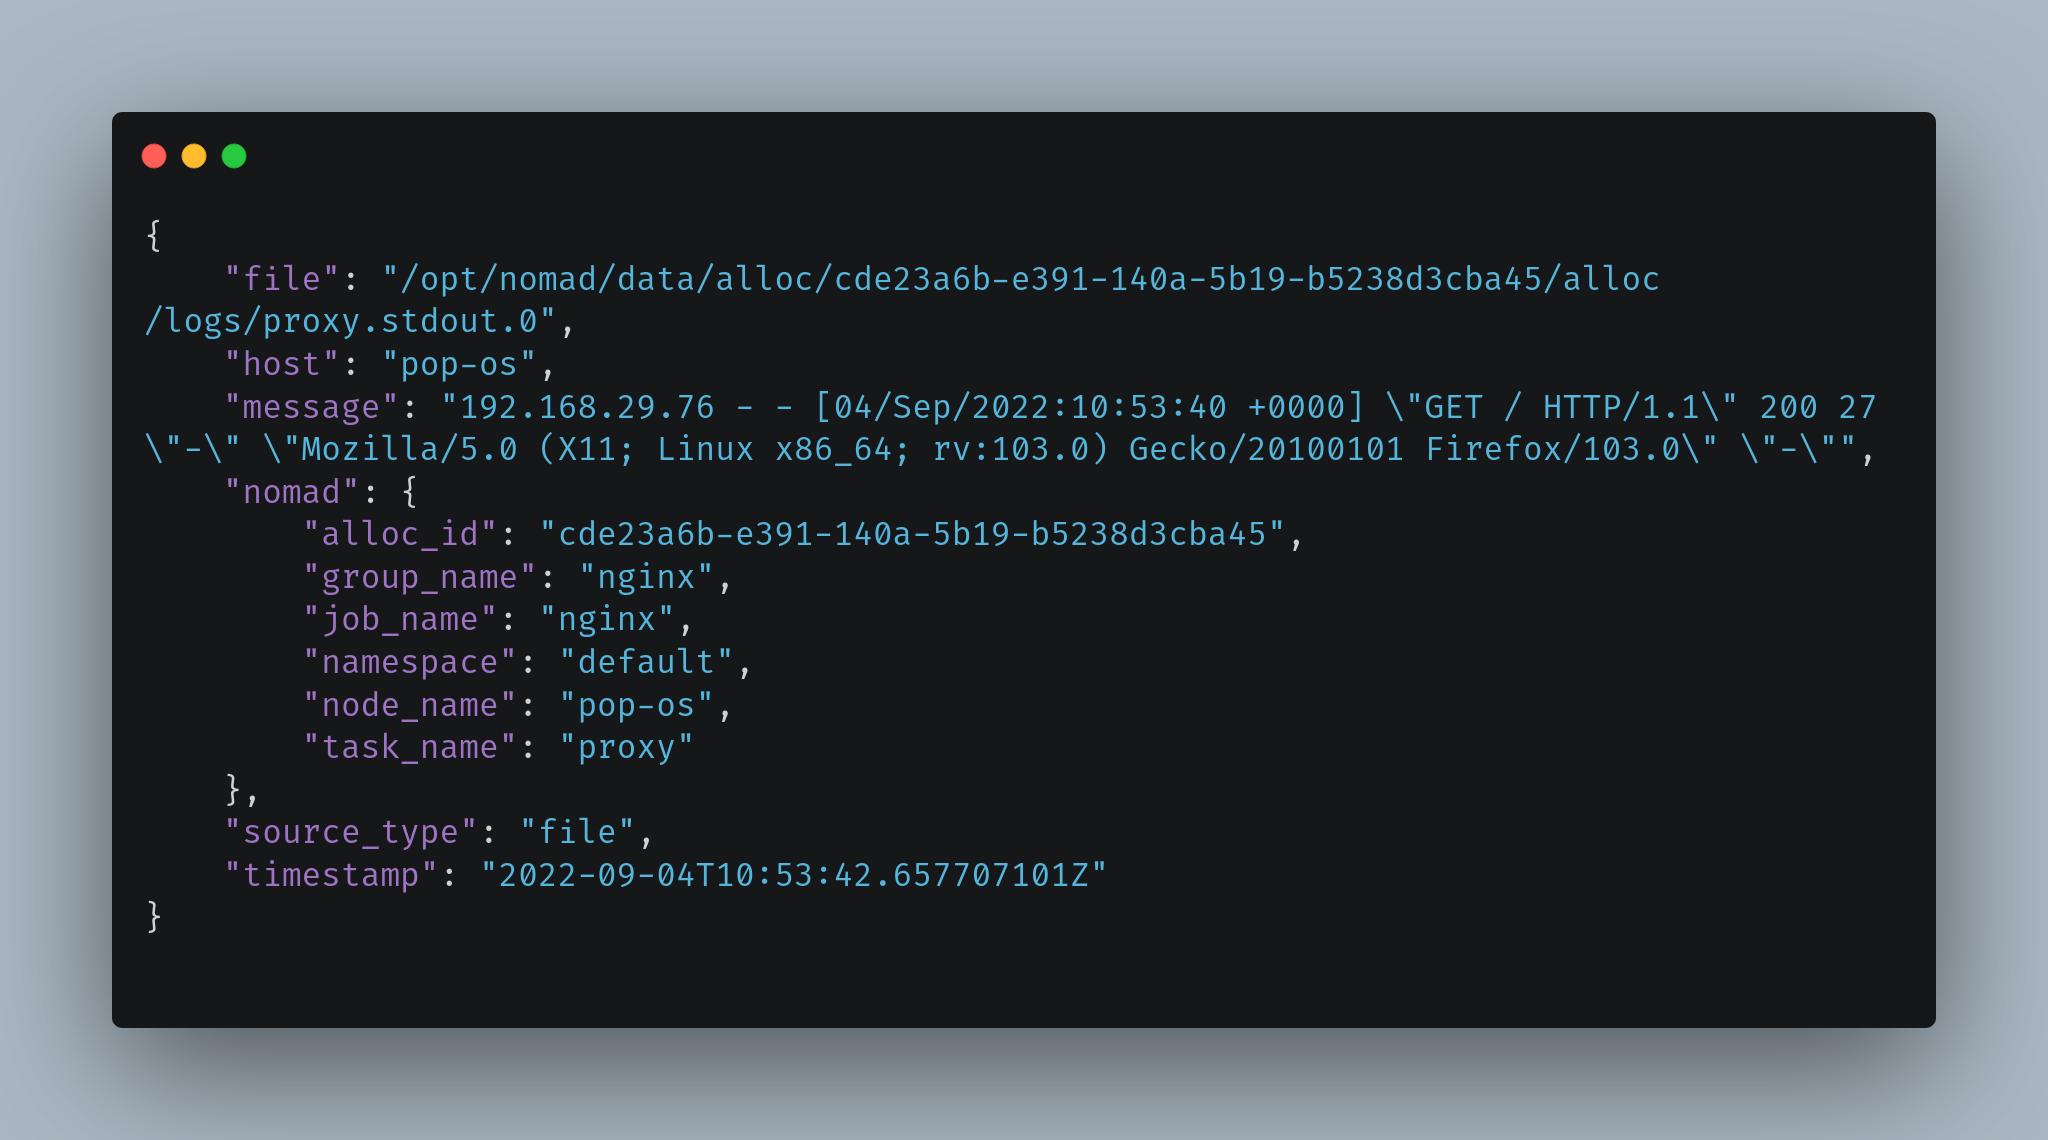
Perfect! We’ve annotated the same log event with Nomad metadata, and Vector will be able to identify these logs. If you’re interested in a complete setup on deploying this to Nomad, take a look at dev setup which contains a Nomad jobspec to deploy nomad-vector-logger as a sidecar with vector as the main task.
Hope this post helped you start configuring a logging pipeline for applications running with non-docker task drivers.
Fin!