Logchef v1.0: The Journey to a Real Log Viewer
About eight months ago I wrote about Logchef – a log viewer I’d been building to scratch my own itch with log exploration at work. Back then it was basically a nicer way to query ClickHouse without writing raw SQL every time. Today I’m shipping v1.0, and it’s evolved into something I didn’t quite expect.
Let me walk through the major features that made it to 1.0 and some of the engineering decisions behind them.
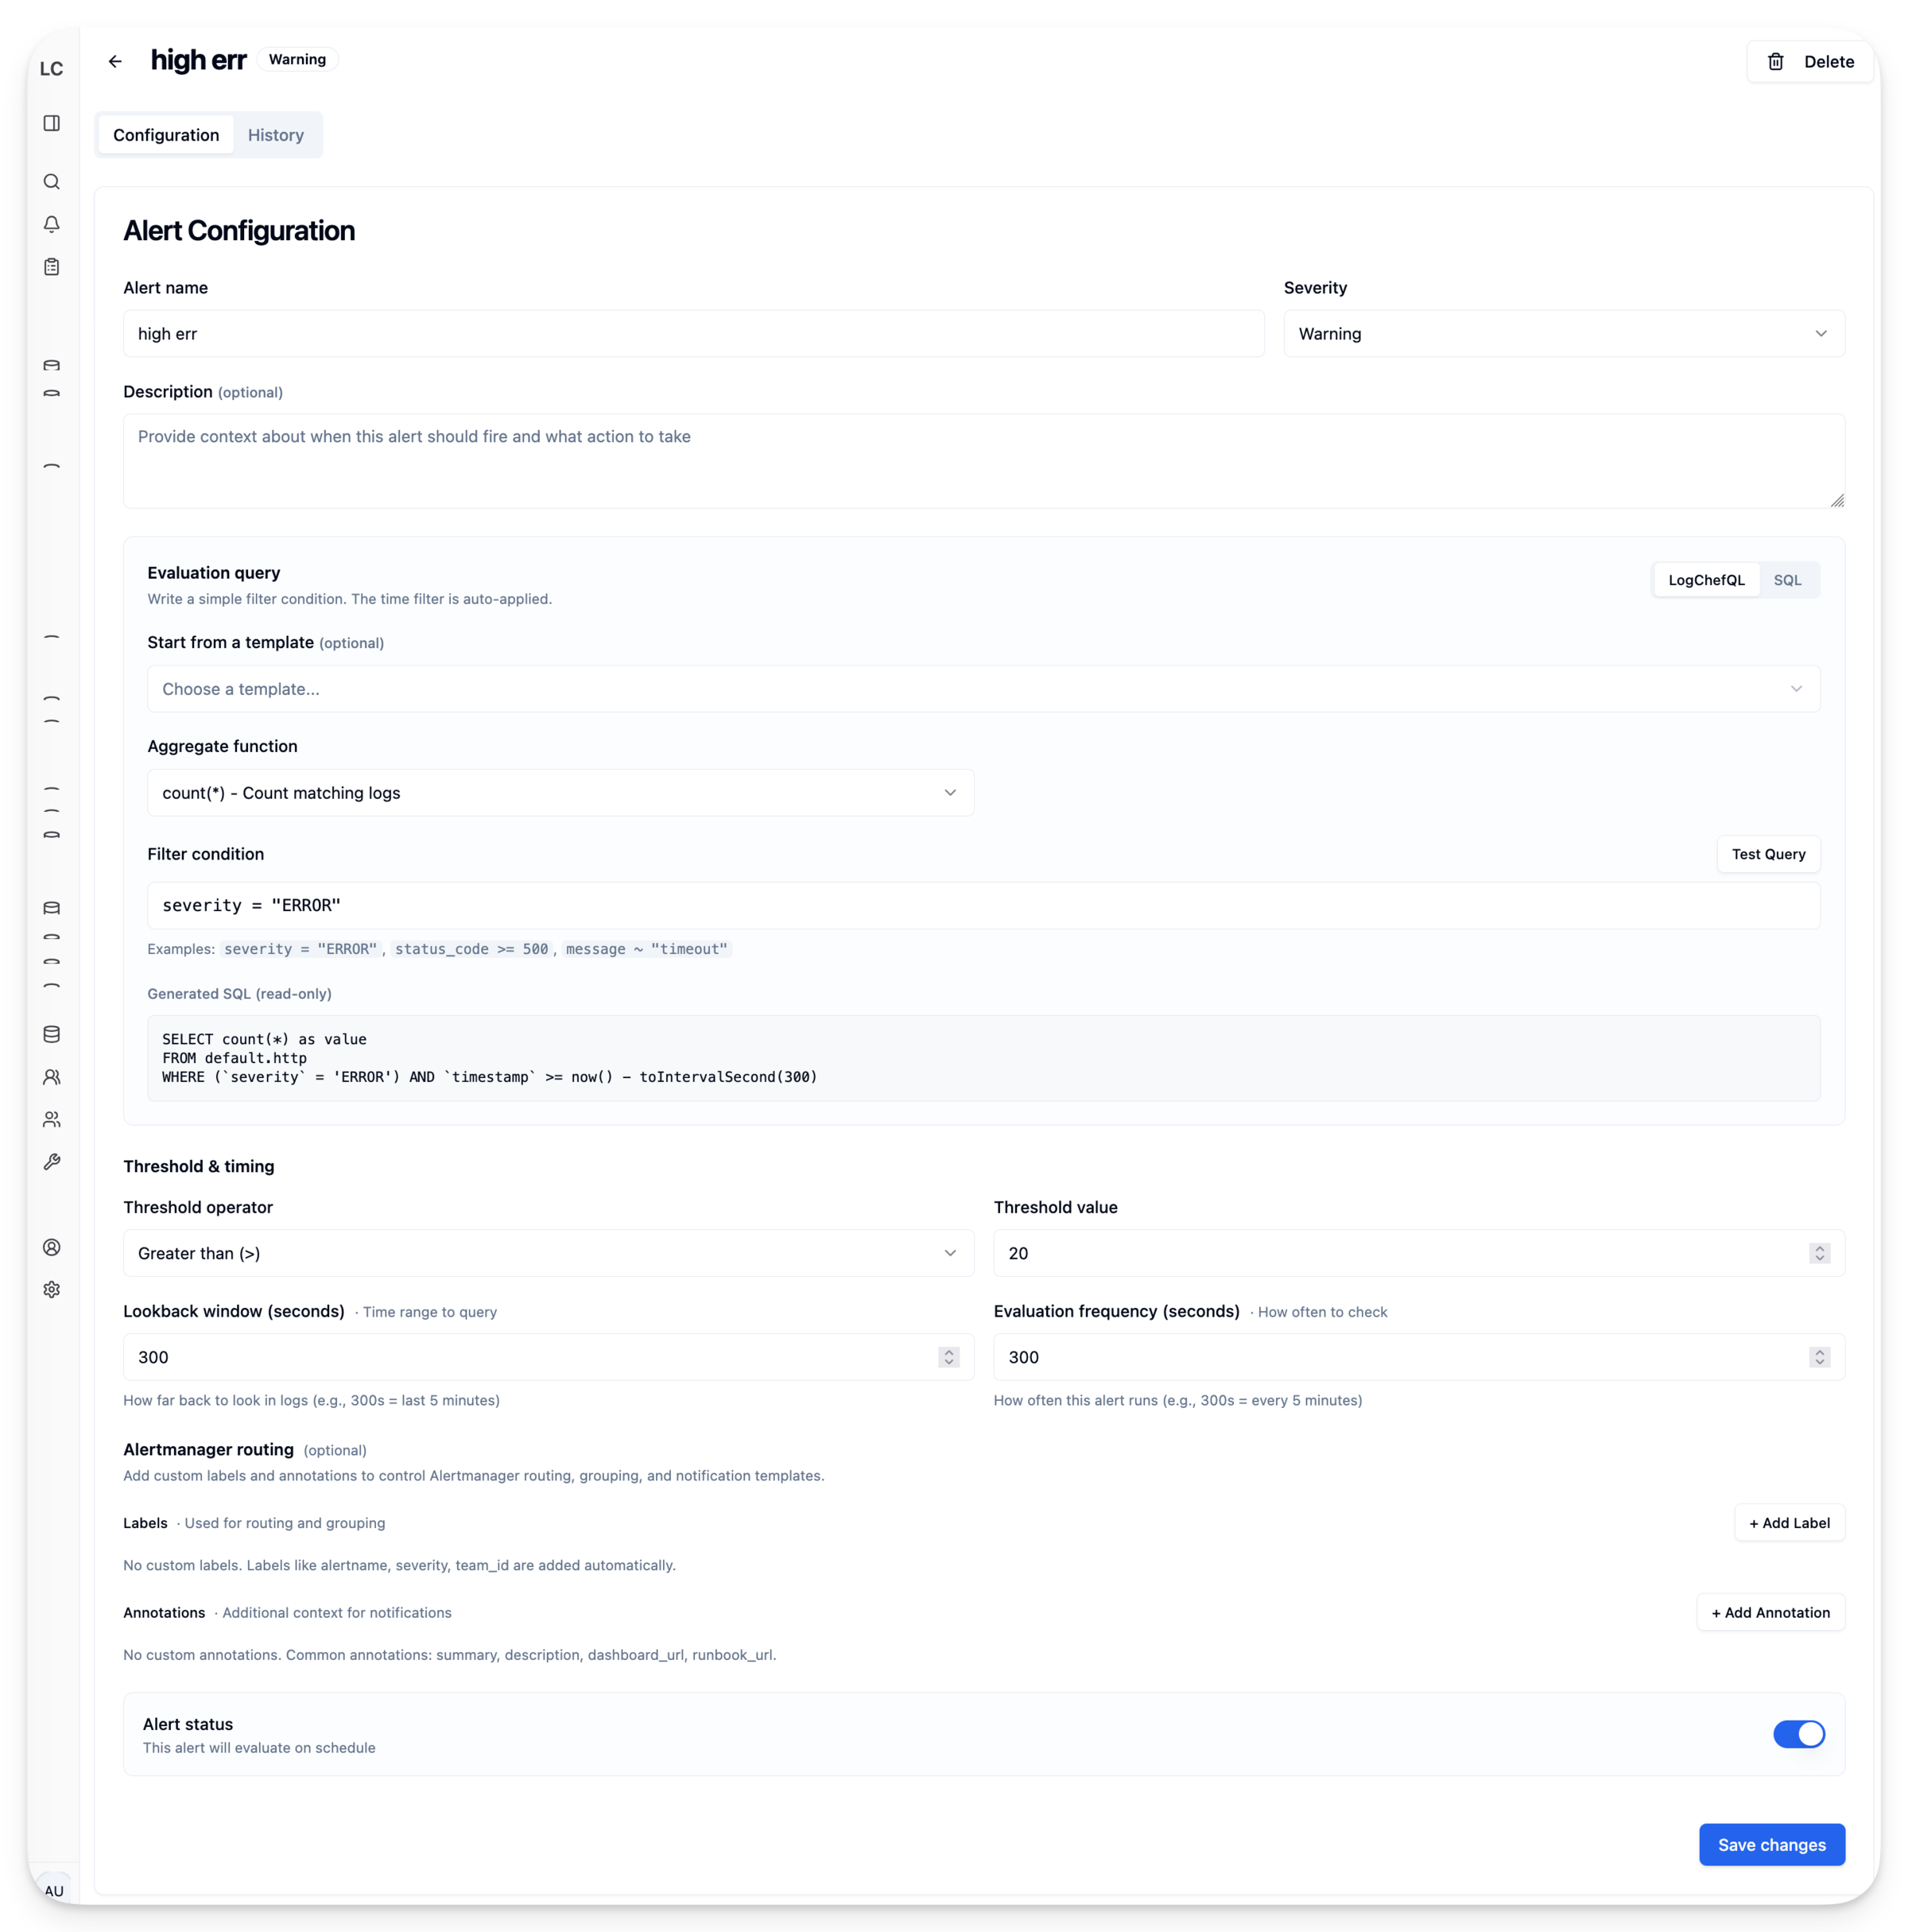
Alerting with Alertmanager Integration#
In that first post, I mentioned alerting as a “roadmap” item. It always felt like the obvious next step – you find a pattern in your logs, you want to know when it happens again.
But building it took longer than expected. My first attempt was a “rooms” system – a home-grown notification router with its own email, Slack, and webhook channels. I got it working, then stared at the code for notification deduplication, grouping, silencing, and escalation. All problems that Alertmanager has already solved and battle-tested in production for years.
So I ripped out rooms and integrated Alertmanager instead. Now Logchef just fires alerts to Alertmanager, and you get all the routing logic – Slack, PagerDuty, email, webhooks, silencing, grouping, inhibition – without me reinventing it poorly.
The workflow is simple: write a LogchefQL or SQL query, set a threshold (e.g., “fire if count > 100”), pick a frequency, configure severity and labels. Logchef runs your query on schedule, evaluates the threshold, and if it triggers, fires an alert. Alert history is stored with execution logs so you can debug why something fired (or didn’t).
LogchefQL: From Toy Parser to Production Backend#
The query language I wrote about originally was pretty basic – just filters that compiled to SQL on the frontend. Over the months it grew into something more capable, but more importantly, I rewrote the entire parser in Go and moved it to the backend. This also opens the door for a CLI tool later – same parser, same query language, different interface.
Here’s what LogchefQL looks like now:
namespace="prod" AND level="error" | message, trace_idThe pipe operator (|) selects specific columns instead of SELECT *:
msg.level="ERROR" | timestamp, msg.request.methodDot notation handles nested JSON fields. If your logs have a log_attributes Map column with nested data:
log_attributes.user.name = "john"For keys that contain dots (common in OTEL-style logs), use quoted field syntax:
log_attributes."http.status_code" >= 500Why Move Parsing to the Backend?#
The original frontend parser was TypeScript. It worked, but had problems:
-
Inconsistency: The frontend generated SQL, but the backend had no idea what that SQL meant. Validation happened in two places.
-
Type-awareness: ClickHouse has
Map,JSON,LowCardinality, and various string types. The frontend didn’t know the schema, so it couldn’t generate optimal SQL for each column type. For aMap(String, String)column, you wantmapContains()or['key']access. ForJSON, you wantJSONExtractString(). For regularString, it’s a simple comparison. -
Debugging hell: When a query failed, was it the parser? The SQL generator? ClickHouse syntax? Everything happened client-side, invisible to server logs.
The new architecture is cleaner:
Frontend                  Backend
   |                         |
   | --- LogchefQL query --> |
   |                         | --> Parse (Go)
   |                         | --> Validate against schema
   |                         | --> Generate type-aware SQL
   | <-- SQL + results ----- | --> Execute on ClickHouse
The backend exposes three endpoints: /logchefql/translate (returns the SQL for “View as SQL”), /logchefql/validate (real-time validation with debouncing), and /logchefql/query (parse, validate, execute, return results).
Moving parsing to the backend also made the field sidebar implementation cleaner – the same schema-aware code that generates WHERE clauses can filter field values based on your current query.
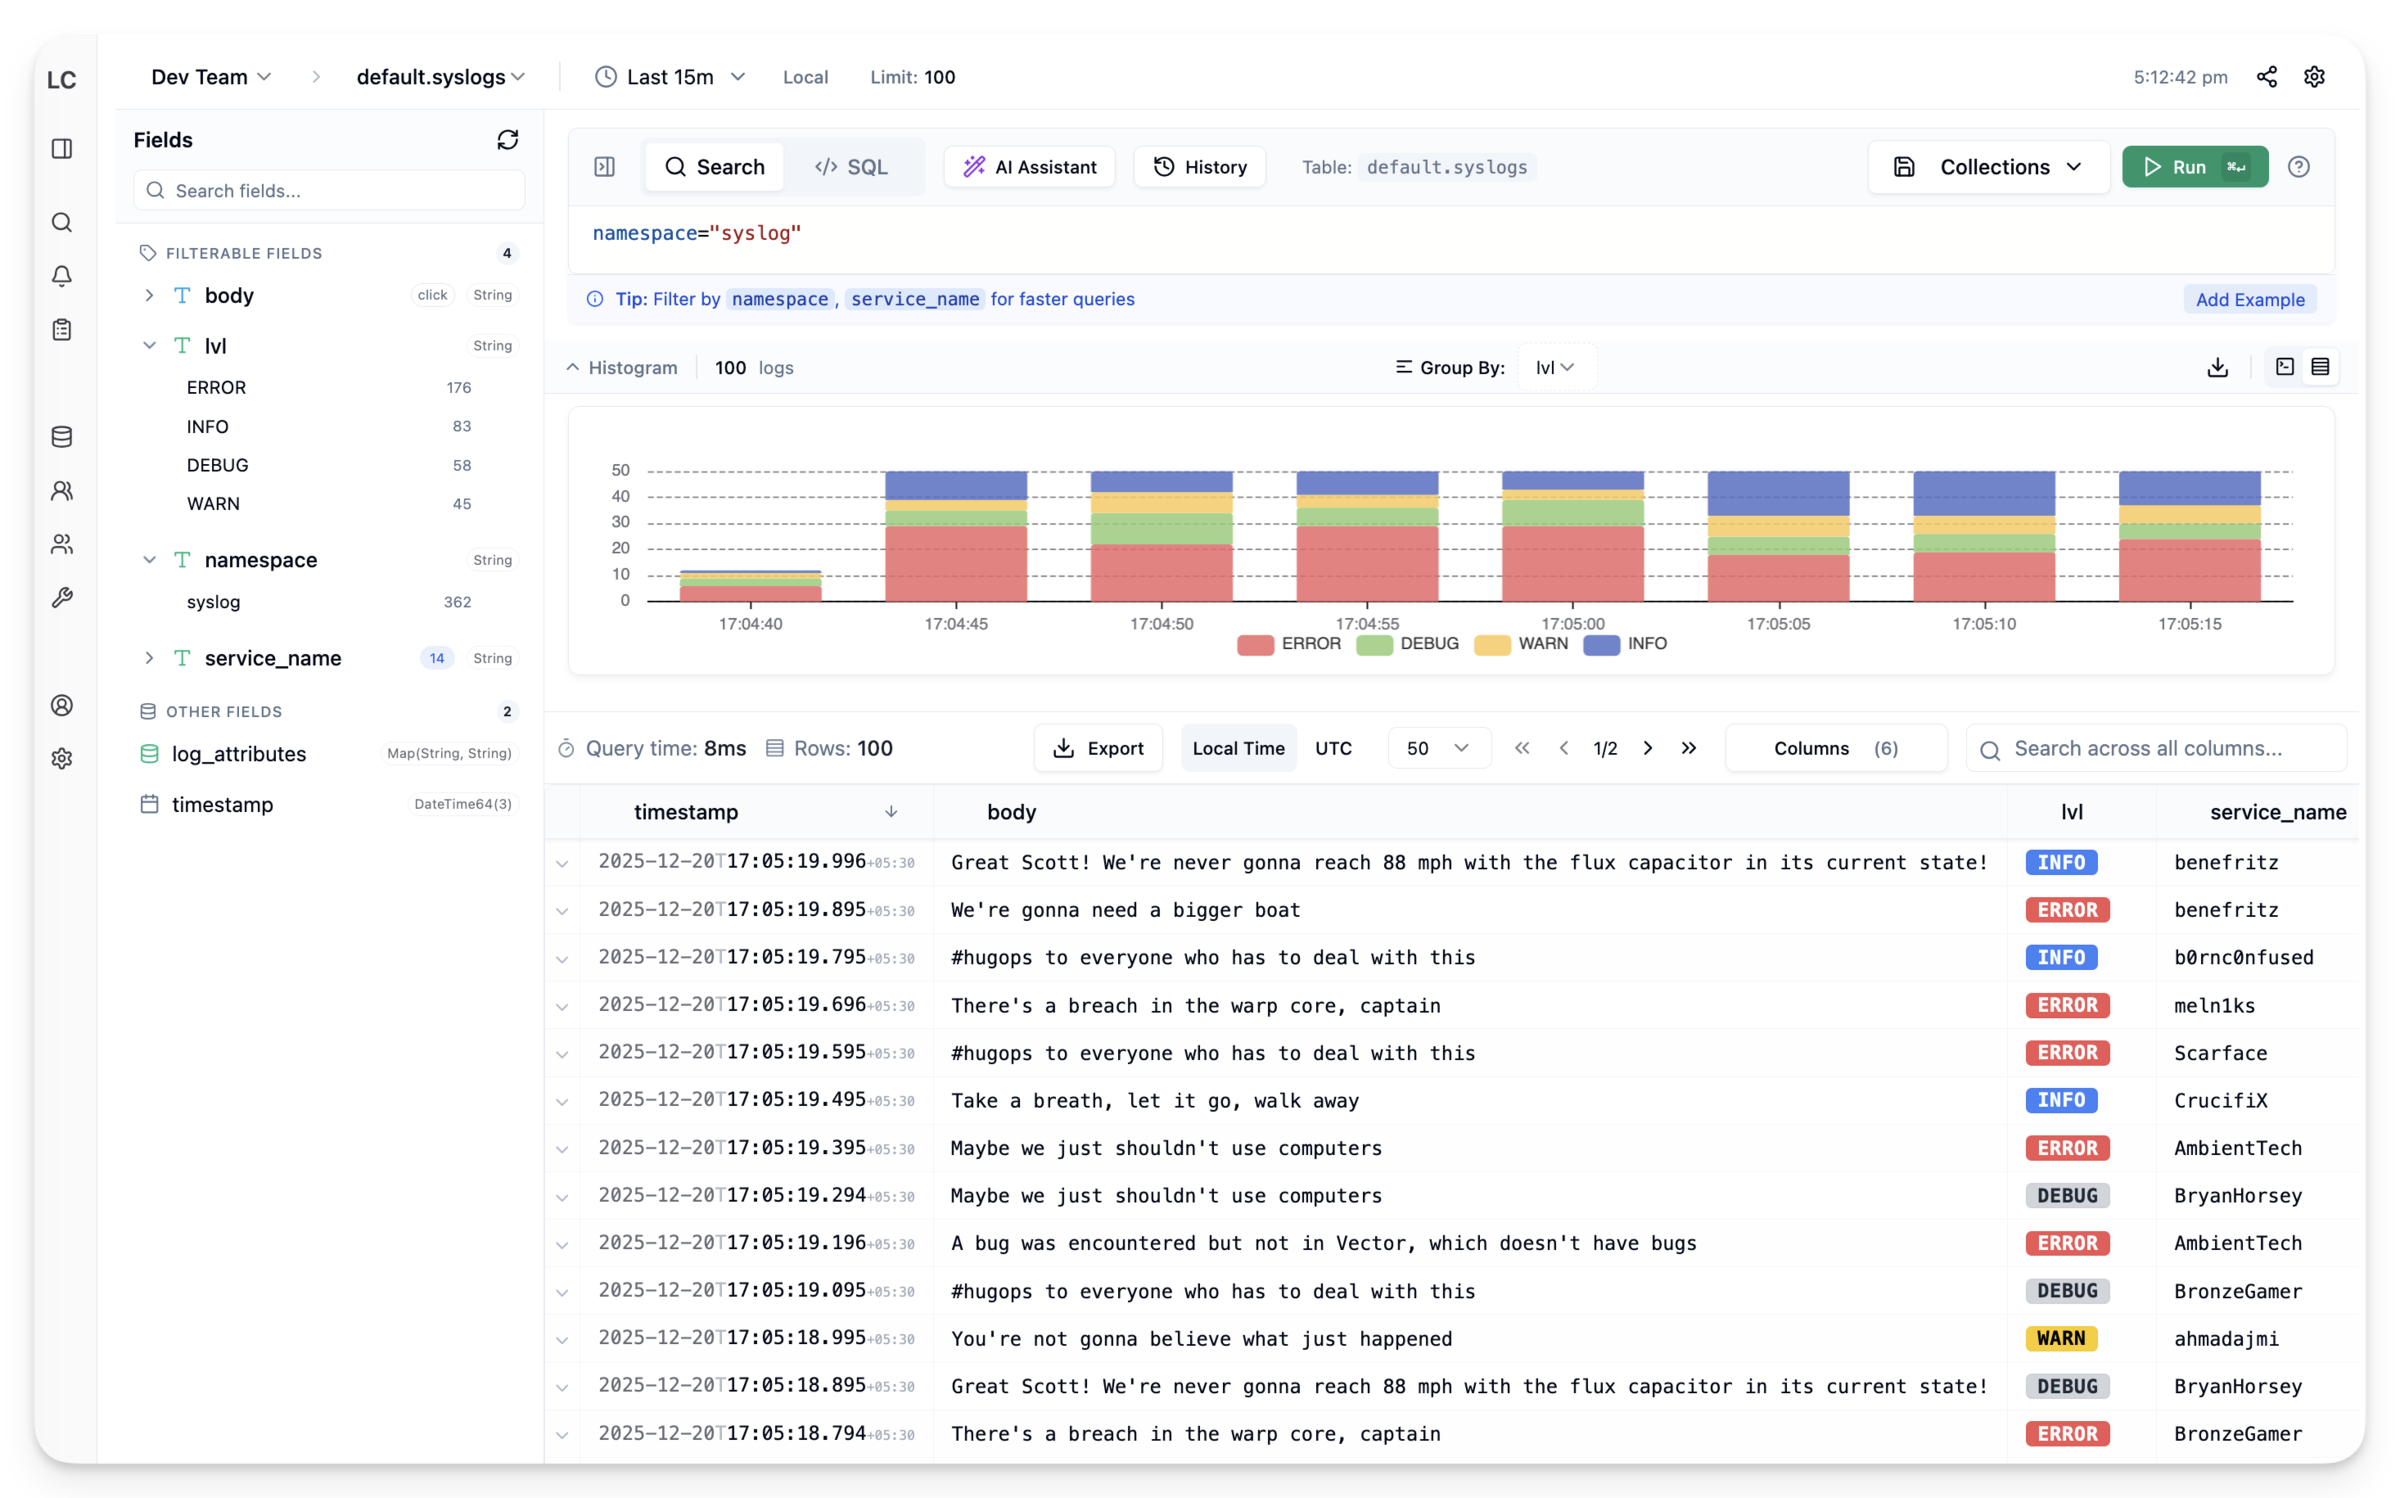
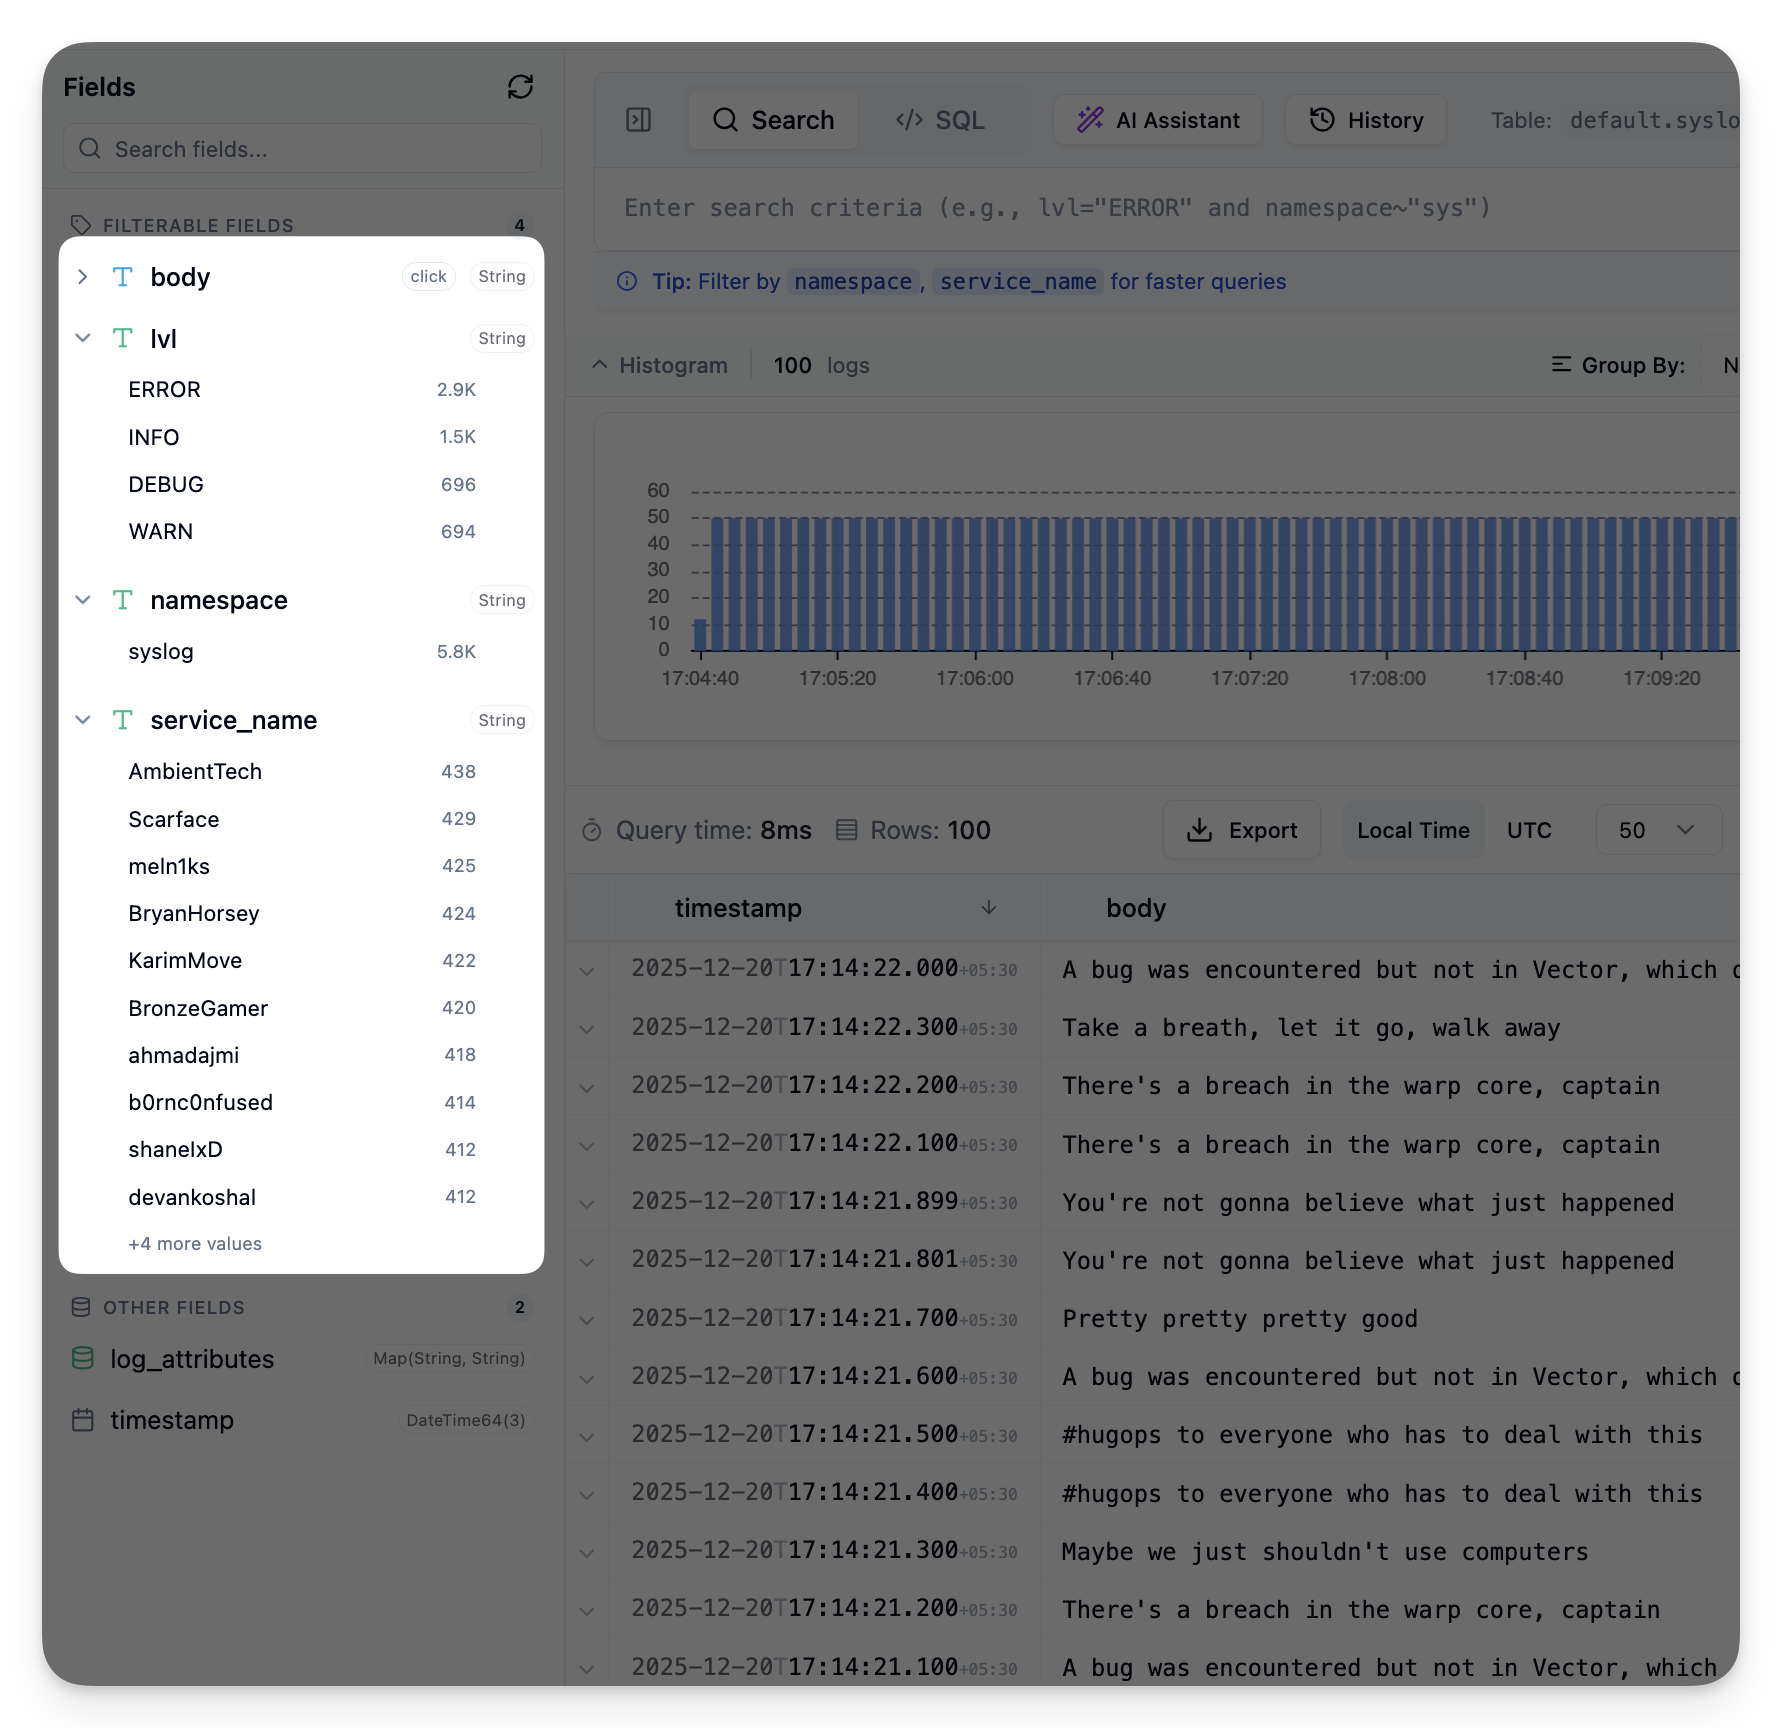
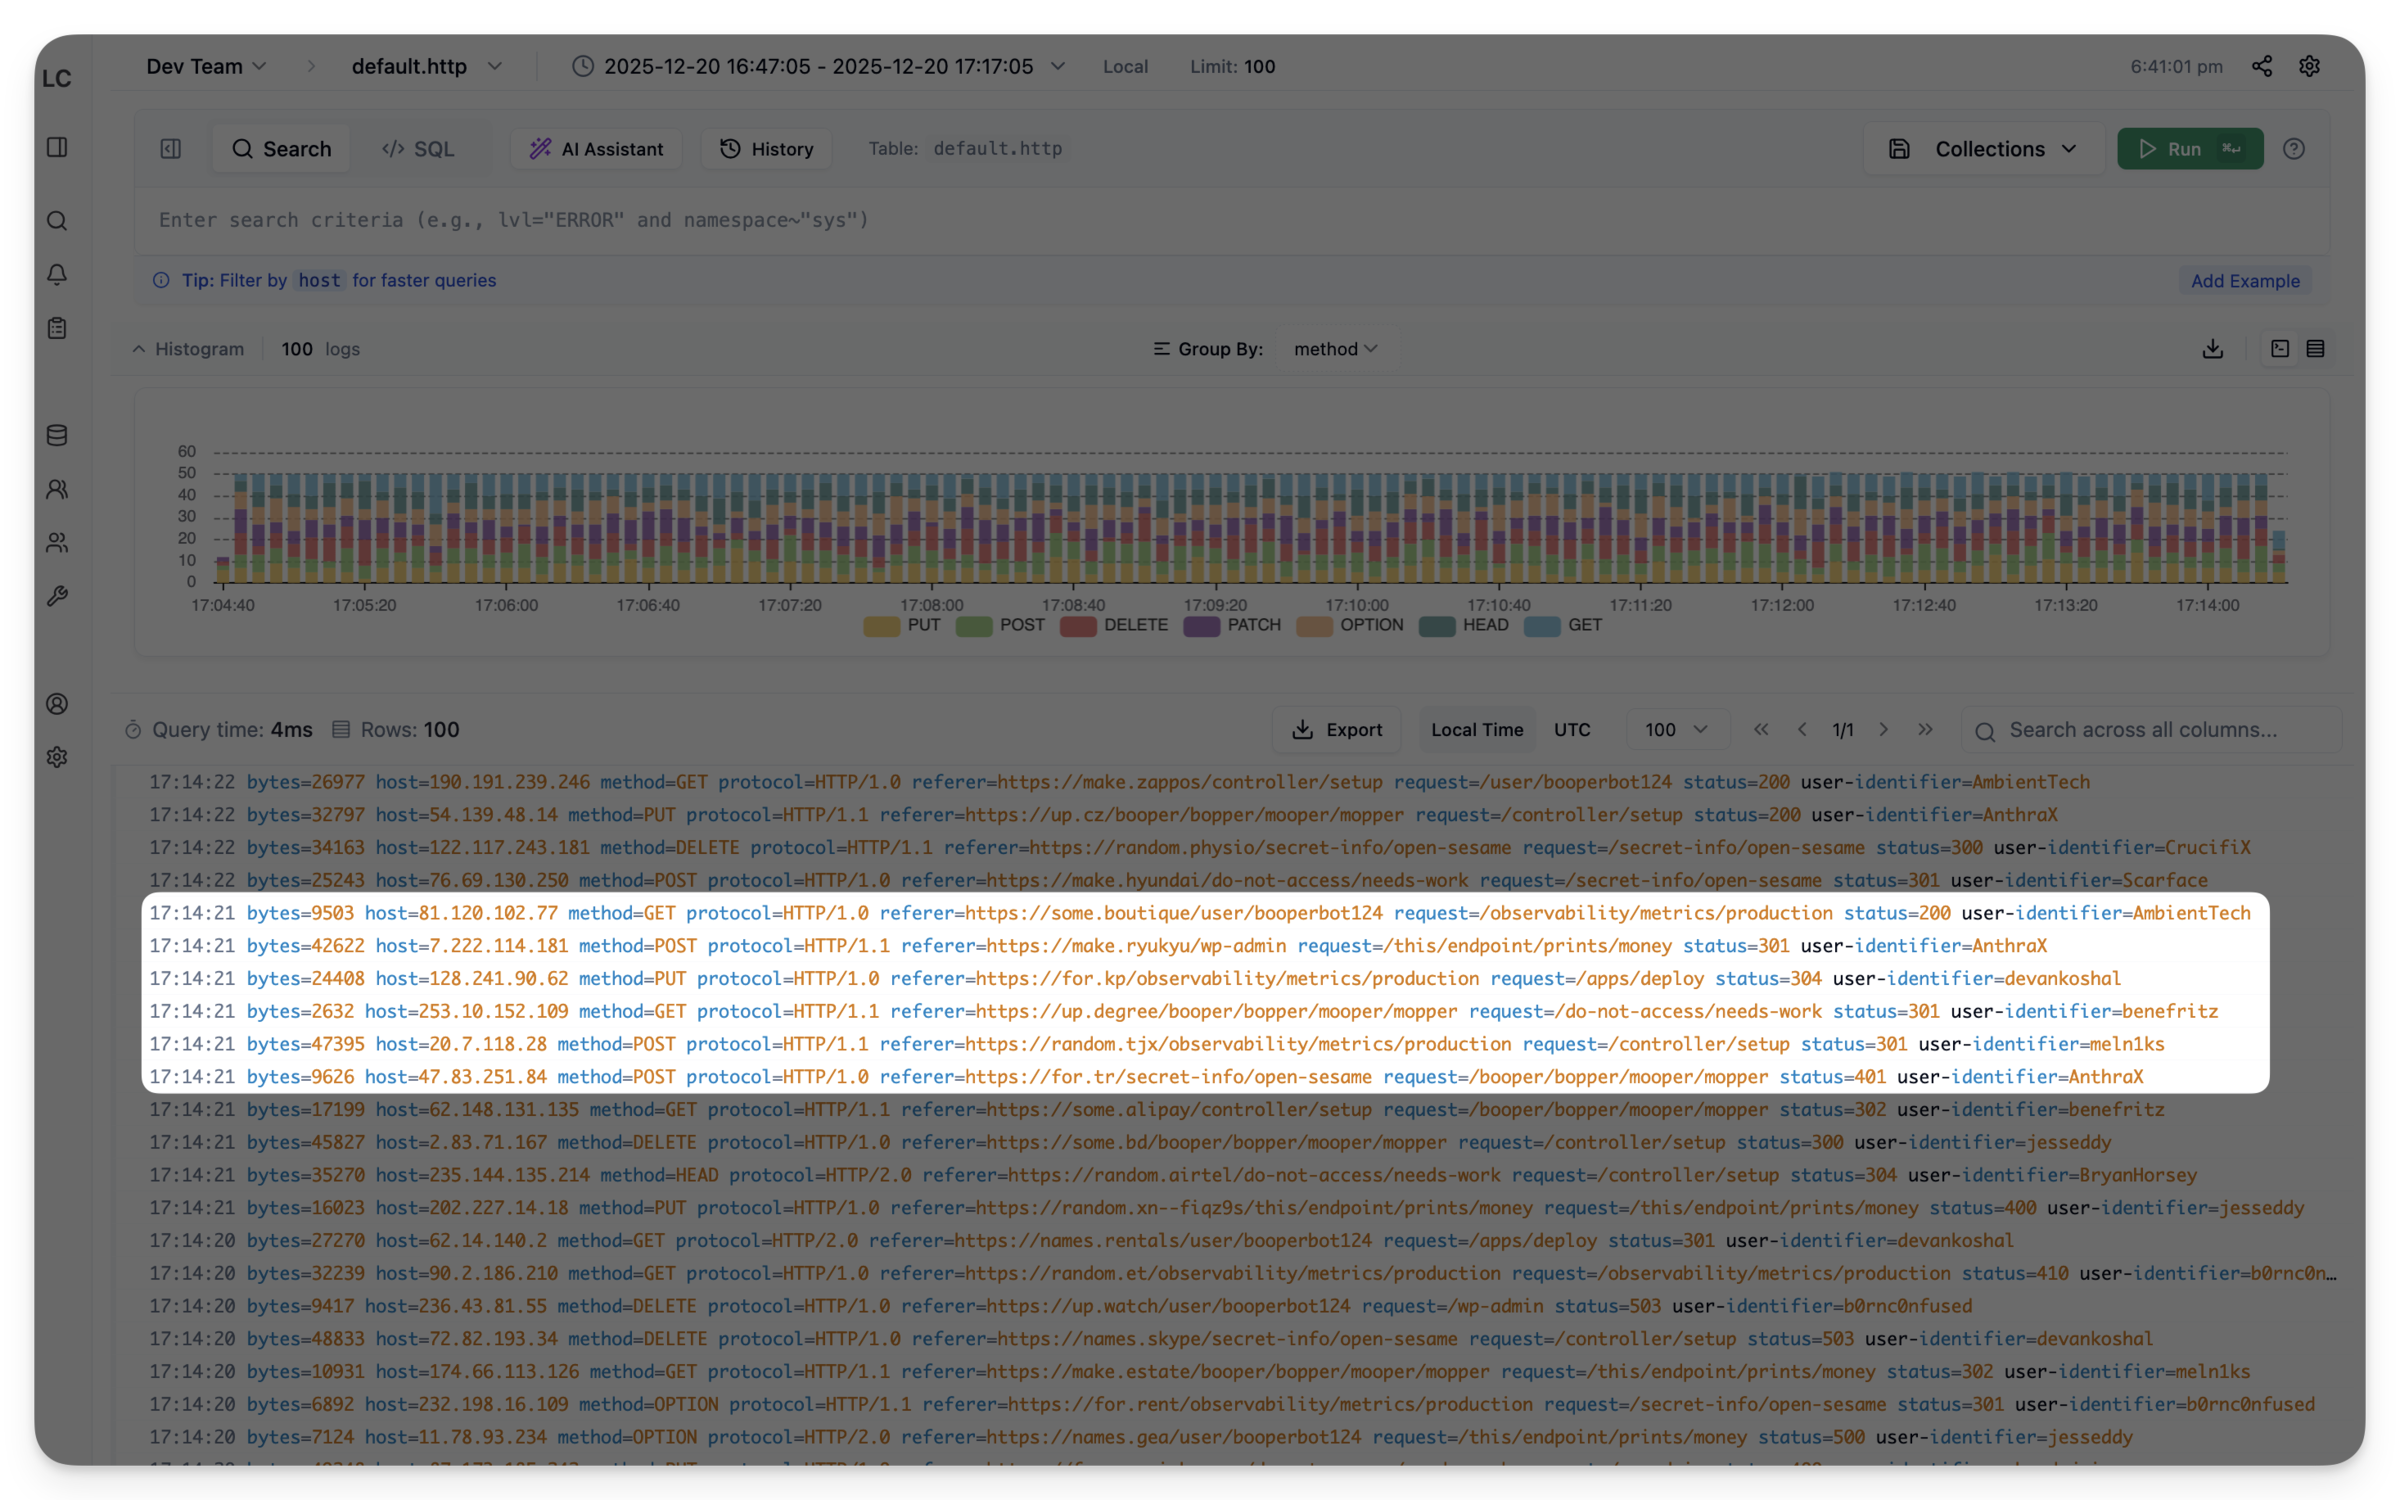
The Field Sidebar#
If you’ve used Kibana, you know the interaction: click a field, see its top values, click a value to add it as a filter. It’s the fastest way to explore logs when you don’t know exactly what you’re looking for.
Building this for ClickHouse required solving a few problems:
High-Cardinality Fields#
You can’t just run SELECT DISTINCT field FROM logs on a table with billions of rows. String fields like trace_id would take forever and return millions of values.
The solution is a hybrid loading strategy based on column types:
- LowCardinality and Enum fields: Auto-load values when the sidebar opens. These are designed for fields with limited distinct values.
- String fields: Require an explicit click. A badge shows the count is unknown until you ask.
- Complex types (Map, Array, Tuple, JSON): Excluded. You can’t have meaningful “distinct values” for a JSON blob.
Progressive Loading#
Each field loads in parallel (max 4 concurrent) with a 15-second timeout. One slow or failed field doesn’t block others – you get a retry button for that specific field.
Query Context#
The sidebar respects your current query. If you’ve filtered to level="error", the field values update to show only values from error logs. This happens through the backend – the field values endpoint accepts the current LogchefQL query and applies it as a WHERE clause filter. Same parser, same SQL generator, consistent results.
Query Cancellation#
Hit Esc and it cancels the query in ClickHouse. Without this, pressing “Cancel” would just hide the spinner – the query kept running on the server, burning resources.
The implementation uses ClickHouse’s query ID feature:
SELECT * FROM logs WHERE ...
SETTINGS query_id = 'logchef-abc123'
When you hit Esc, the frontend calls a cancellation endpoint that runs:
KILL QUERY WHERE query_id = 'logchef-abc123'The original query returns an error, the UI clears, ClickHouse frees resources. Simple, but requires plumbing the query ID through every execution path.
AI Query Assistant#
“Write a query that finds slowest endpoints by p99” actually works. The AI generates LogchefQL or SQL based on natural language and your table schema.
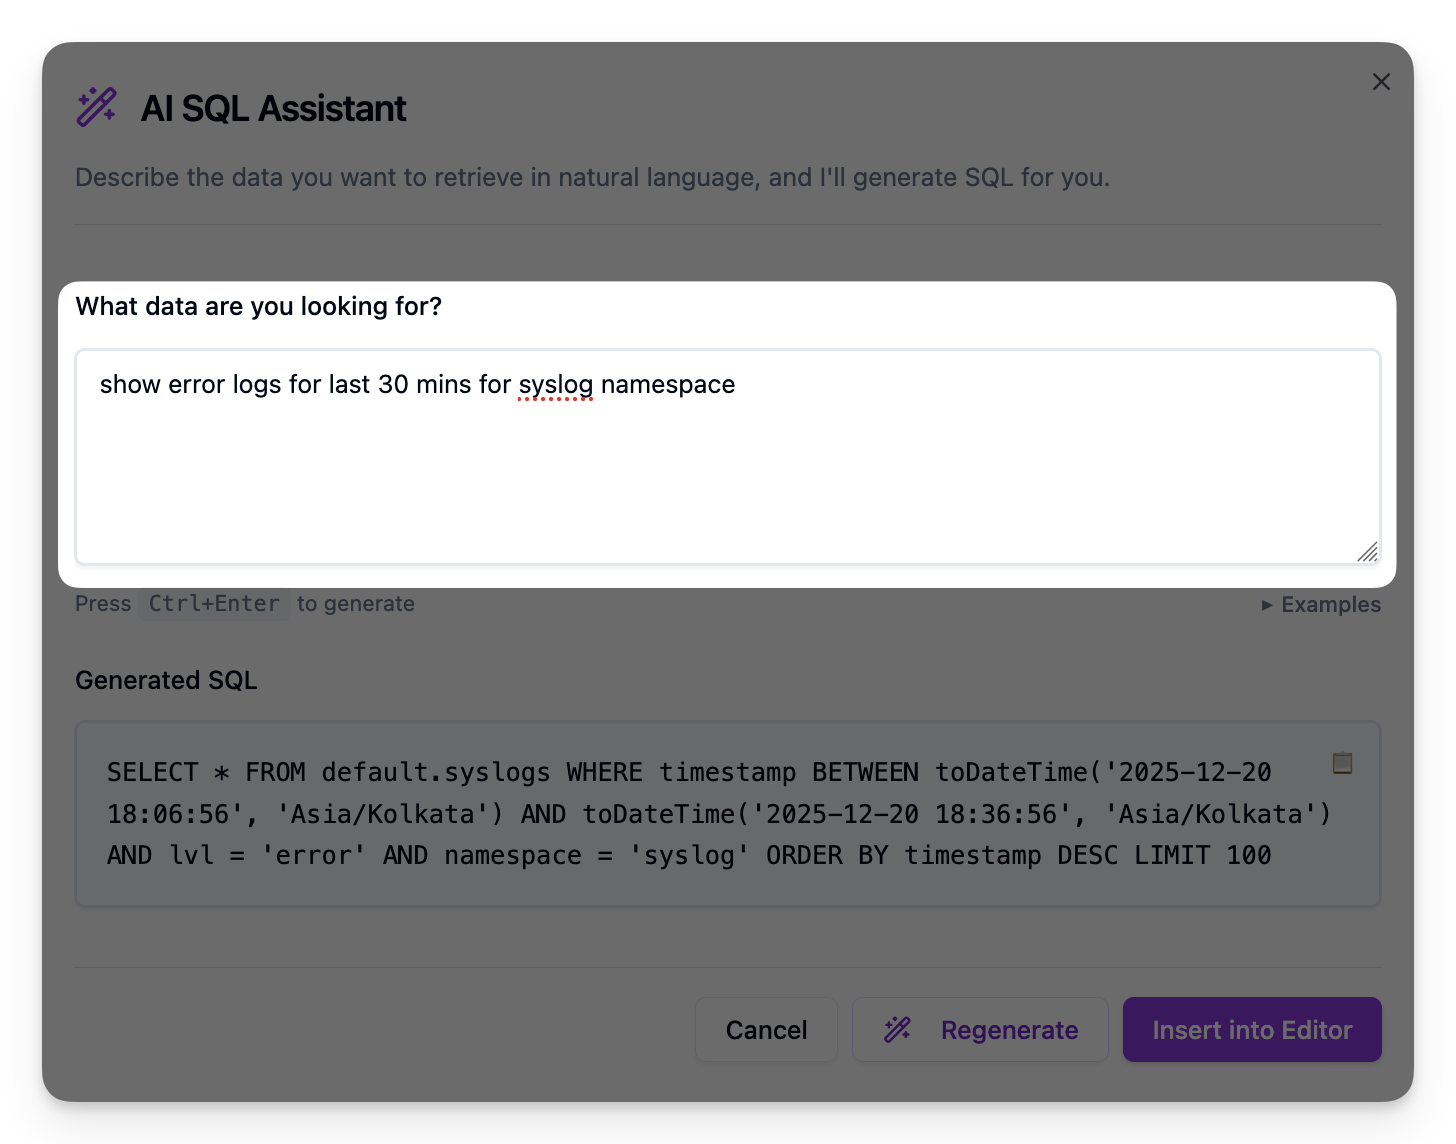
Under the hood it uses go-openai, so any OpenAI-compatible endpoint works – OpenAI, Ollama, vLLM, whatever you prefer. The system prompt includes your table schema so the model knows what fields exist.
There’s also an MCP server that exposes Logchef to AI assistants like Claude Desktop, Cursor, or any MCP-compatible client. Instead of context-switching between your AI chat and the log viewer, you can ask directly:
- “What log sources do I have access to?”
- “Find all 500 errors in the last hour from the web service”
- “Show me a histogram of log volume over the past day”
- “What are the most common error messages in the database logs?”
The MCP server handles discovery (teams, sources, schemas), querying (full ClickHouse SQL), analysis (histograms, saved queries), and even admin operations. It’s a separate binary that runs alongside Logchef – configure it once, and your AI assistant can query your logs through natural conversation.
Compact View for Terminal Lovers#
Not everyone wants a table. The compact view is a terminal-style display that shows logs as formatted text with syntax highlighting. Denser and faster to scan for certain debugging workflows.
Query Variables#
Use {{namespace}} in your query, and an input field appears automatically. Great for saved queries that teams want to reuse with different parameters.
This was a community contribution from @songxuanqing. The implementation detects {{variable}} patterns in the query text and renders input fields dynamically.
Team Management and RBAC#
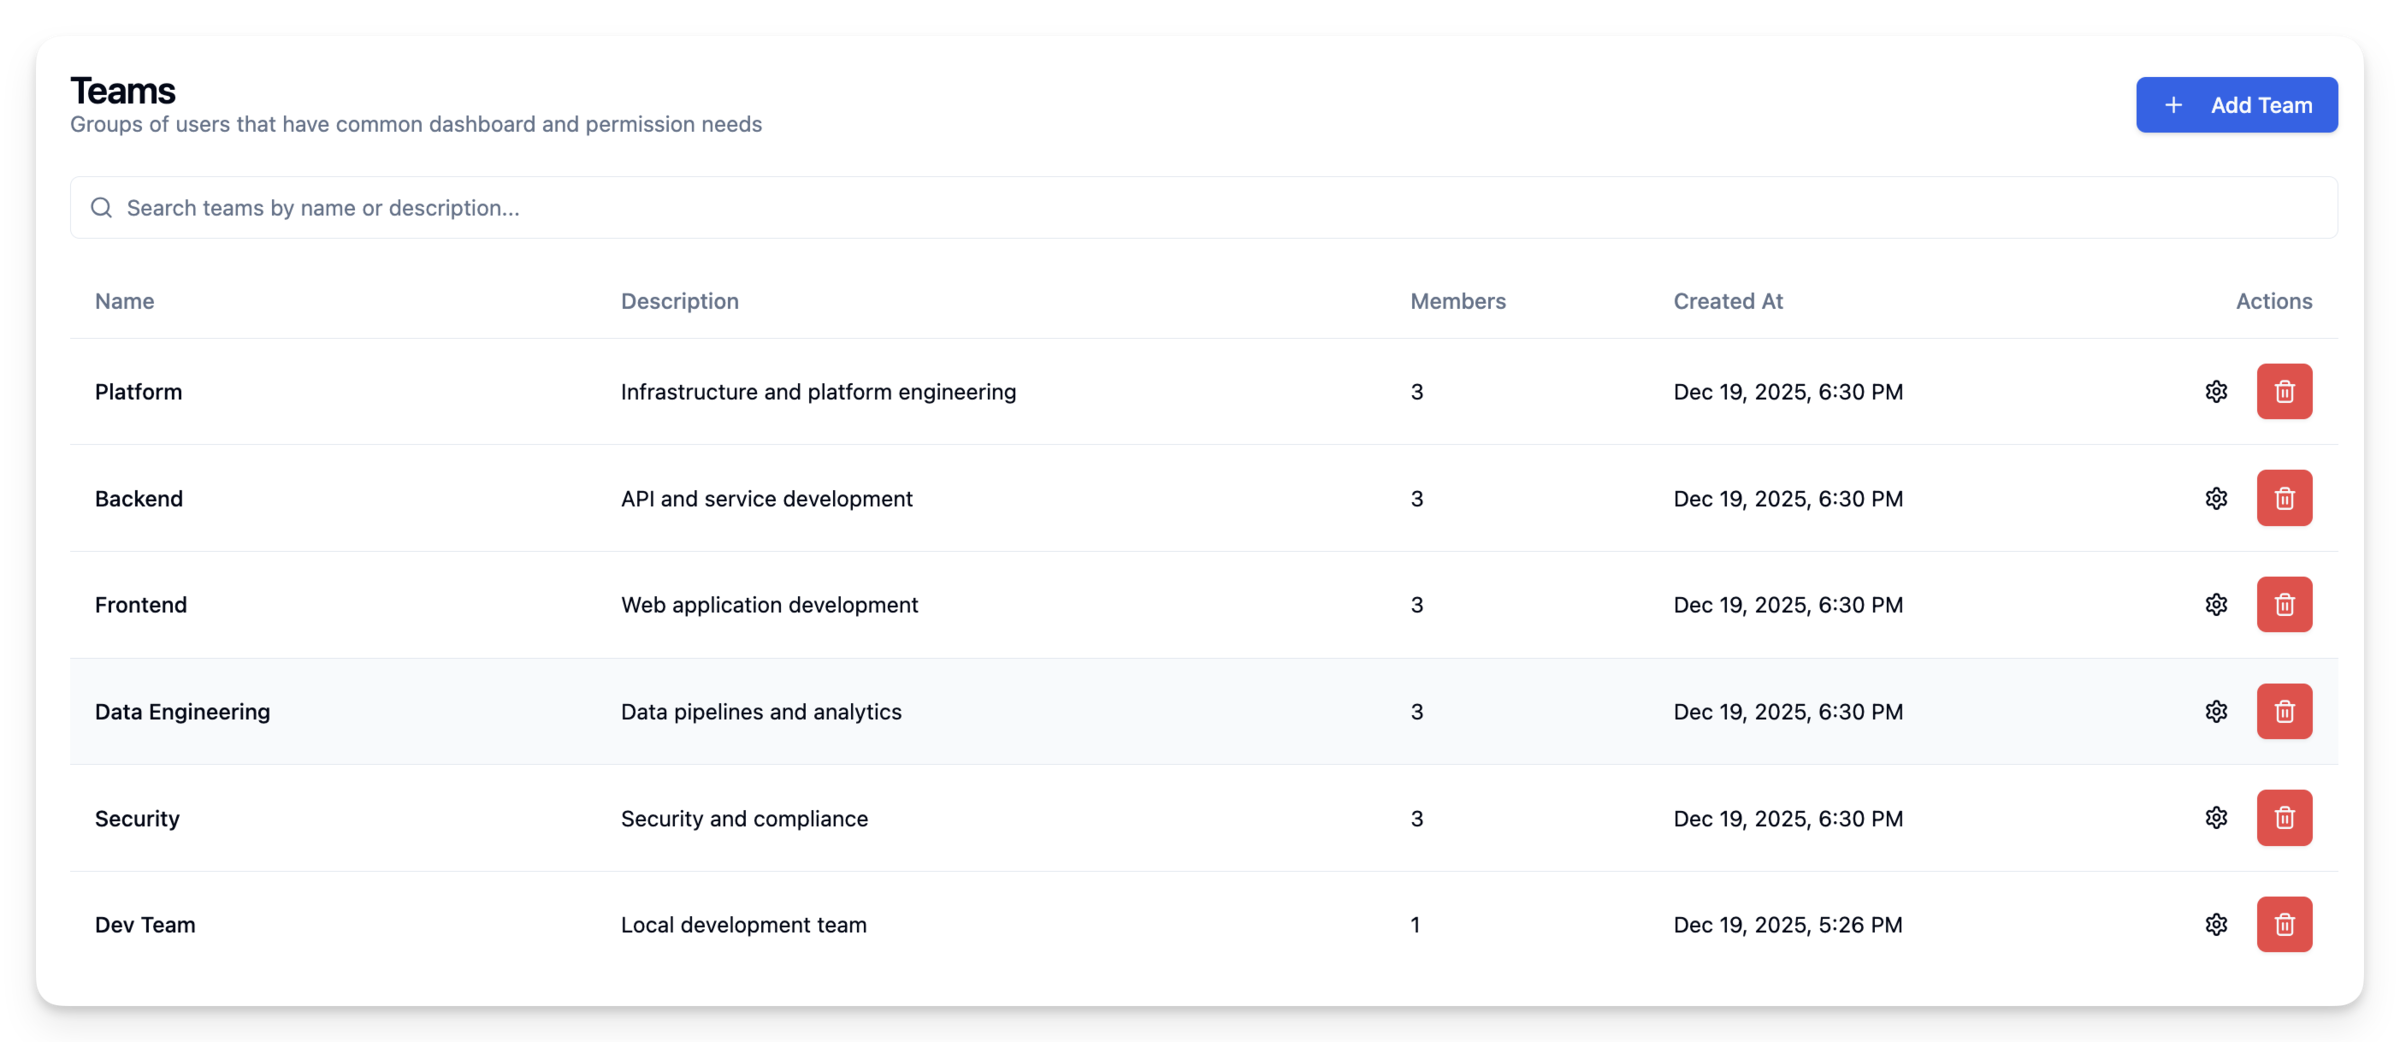
Logchef supports multi-tenancy with role-based access. Teams can have multiple data sources, and users can be members of multiple teams with different roles:
- Admin: Full access, can manage team members and sources
- Editor: Can create/edit saved queries and collections
- Viewer: Read-only access to query and explore logs
This integrates with OIDC for SSO, so you can use your existing identity provider.
Admin UI for Runtime Config#
Configure stuff without touching config files. The admin settings panel lets you change AI configuration, Alertmanager connection, authentication settings, and query timeouts.
This was a migration from config files to database-backed settings. On first boot, Logchef seeds the database from config.toml. After that, the UI takes over and changes are stored in SQLite. Backward compatible – existing config files still work, the UI just overrides them at runtime. No more SSH-ing into production to bump a timeout.
Prometheus Metrics#
A /metrics endpoint exposes query execution times, error rates, active queries, and other operational data. There’s a pre-built Grafana dashboard for monitoring Logchef itself.
What’s Not in 1.0#
Some things didn’t make the cut:
- Live tail: Streaming logs in real-time. Still on the roadmap.
- Dashboarding: Multiple visualizations on one page. Logchef is query-focused; for dashboards, you probably want Grafana with ClickHouse as a datasource.
Calling It 1.0#
Calling something “1.0” is weird. There’s no clear line where software becomes “ready.” But I’ve been using Logchef daily at work for months now, and it’s at the point where I trust it. The rough edges are mostly smoothed out. The architecture feels right.
Building tools you use yourself is different. You’re the first to hit the rough edges, so you fix them. Slower than building for imaginary users, but the result is something you actually want to use.
Thanks again to Kailash for the early direction (schema-agnostic was his idea), and to everyone at Zerodha who’s been using this and giving feedback. Thanks to @songxuanqing for query variables and other contributors for docs and bug fixes.
Demo | Docs | GitHub | v1.0.0 Release
Fin!