Announcing Logchef
So, for the last 3-4 months, I’ve been busy building Logchef. This tool basically grew straight out of my day job managing logs at Zerodha, where I’ve been managing logs for almost half a decade. I wanted to share a bit about how Logchef came to be.
Like many, we journeyed through the complexities of ELK (a management nightmare) and found its OSS fork, OpenSearch, didn’t quite hit the mark for us either. We eventually found solid ground with Clickhouse, as detailed on our tech blog: Logging at Zerodha.
Challenges Faced with Metabase#
However, as I noted in that post, while Metabase served us well for analytics, it wasn’t the ideal UI specifically tailored for log analysis against Clickhouse:
“While Metabase has served us well so far, there is certainly room for improvement, especially regarding a more tailored UI for Clickhouse… we plan to continue exploring potential solutions.”
Here’s a distilled version of the common pain points we experienced:
- Ad-hoc Querying Was Painful: Writing raw Clickhouse SQL in Metabase for quick log searches felt cumbersome and slow. Even modifying existing complex query templates was error-prone – a tiny syntax mistake could lead to minutes spent debugging the query itself, especially stressful during production incidents.
- Disconnect Between Visualization and Raw Logs: A common workflow is to visualize trends (e.g., errors over time) and then drill down into the specific logs causing those trends. In Metabase, this often meant writing two separate queries – one for aggregation/visualization and another (often rewritten from scratch) just to see the raw log lines. Metabase’s row limits (around 2k) further complicated viewing the full context of raw logs after filtering. The intuitive “slice and drill-down” experience many log tools offer was missing.
- UI/UX Annoyances: Several smaller but cumulative issues added friction: difficulty selecting precise time ranges like “last 6 hours,” viewing logs immediately surrounding a relevant event, columns getting truncated (
...), and limited timestamp precision display in results. Though there are some workarounds, they often felt like band-aids rather than solutions.
TL;DR: Metabase interface wasn’t optimized for the specific task of log exploration. Debugging sessions that should have taken minutes were stretching significantly longer. Querying and exploring logs felt clunkier than it needed to be.
And one fine day, I decided to stop just wishing for a better tool and start building one:
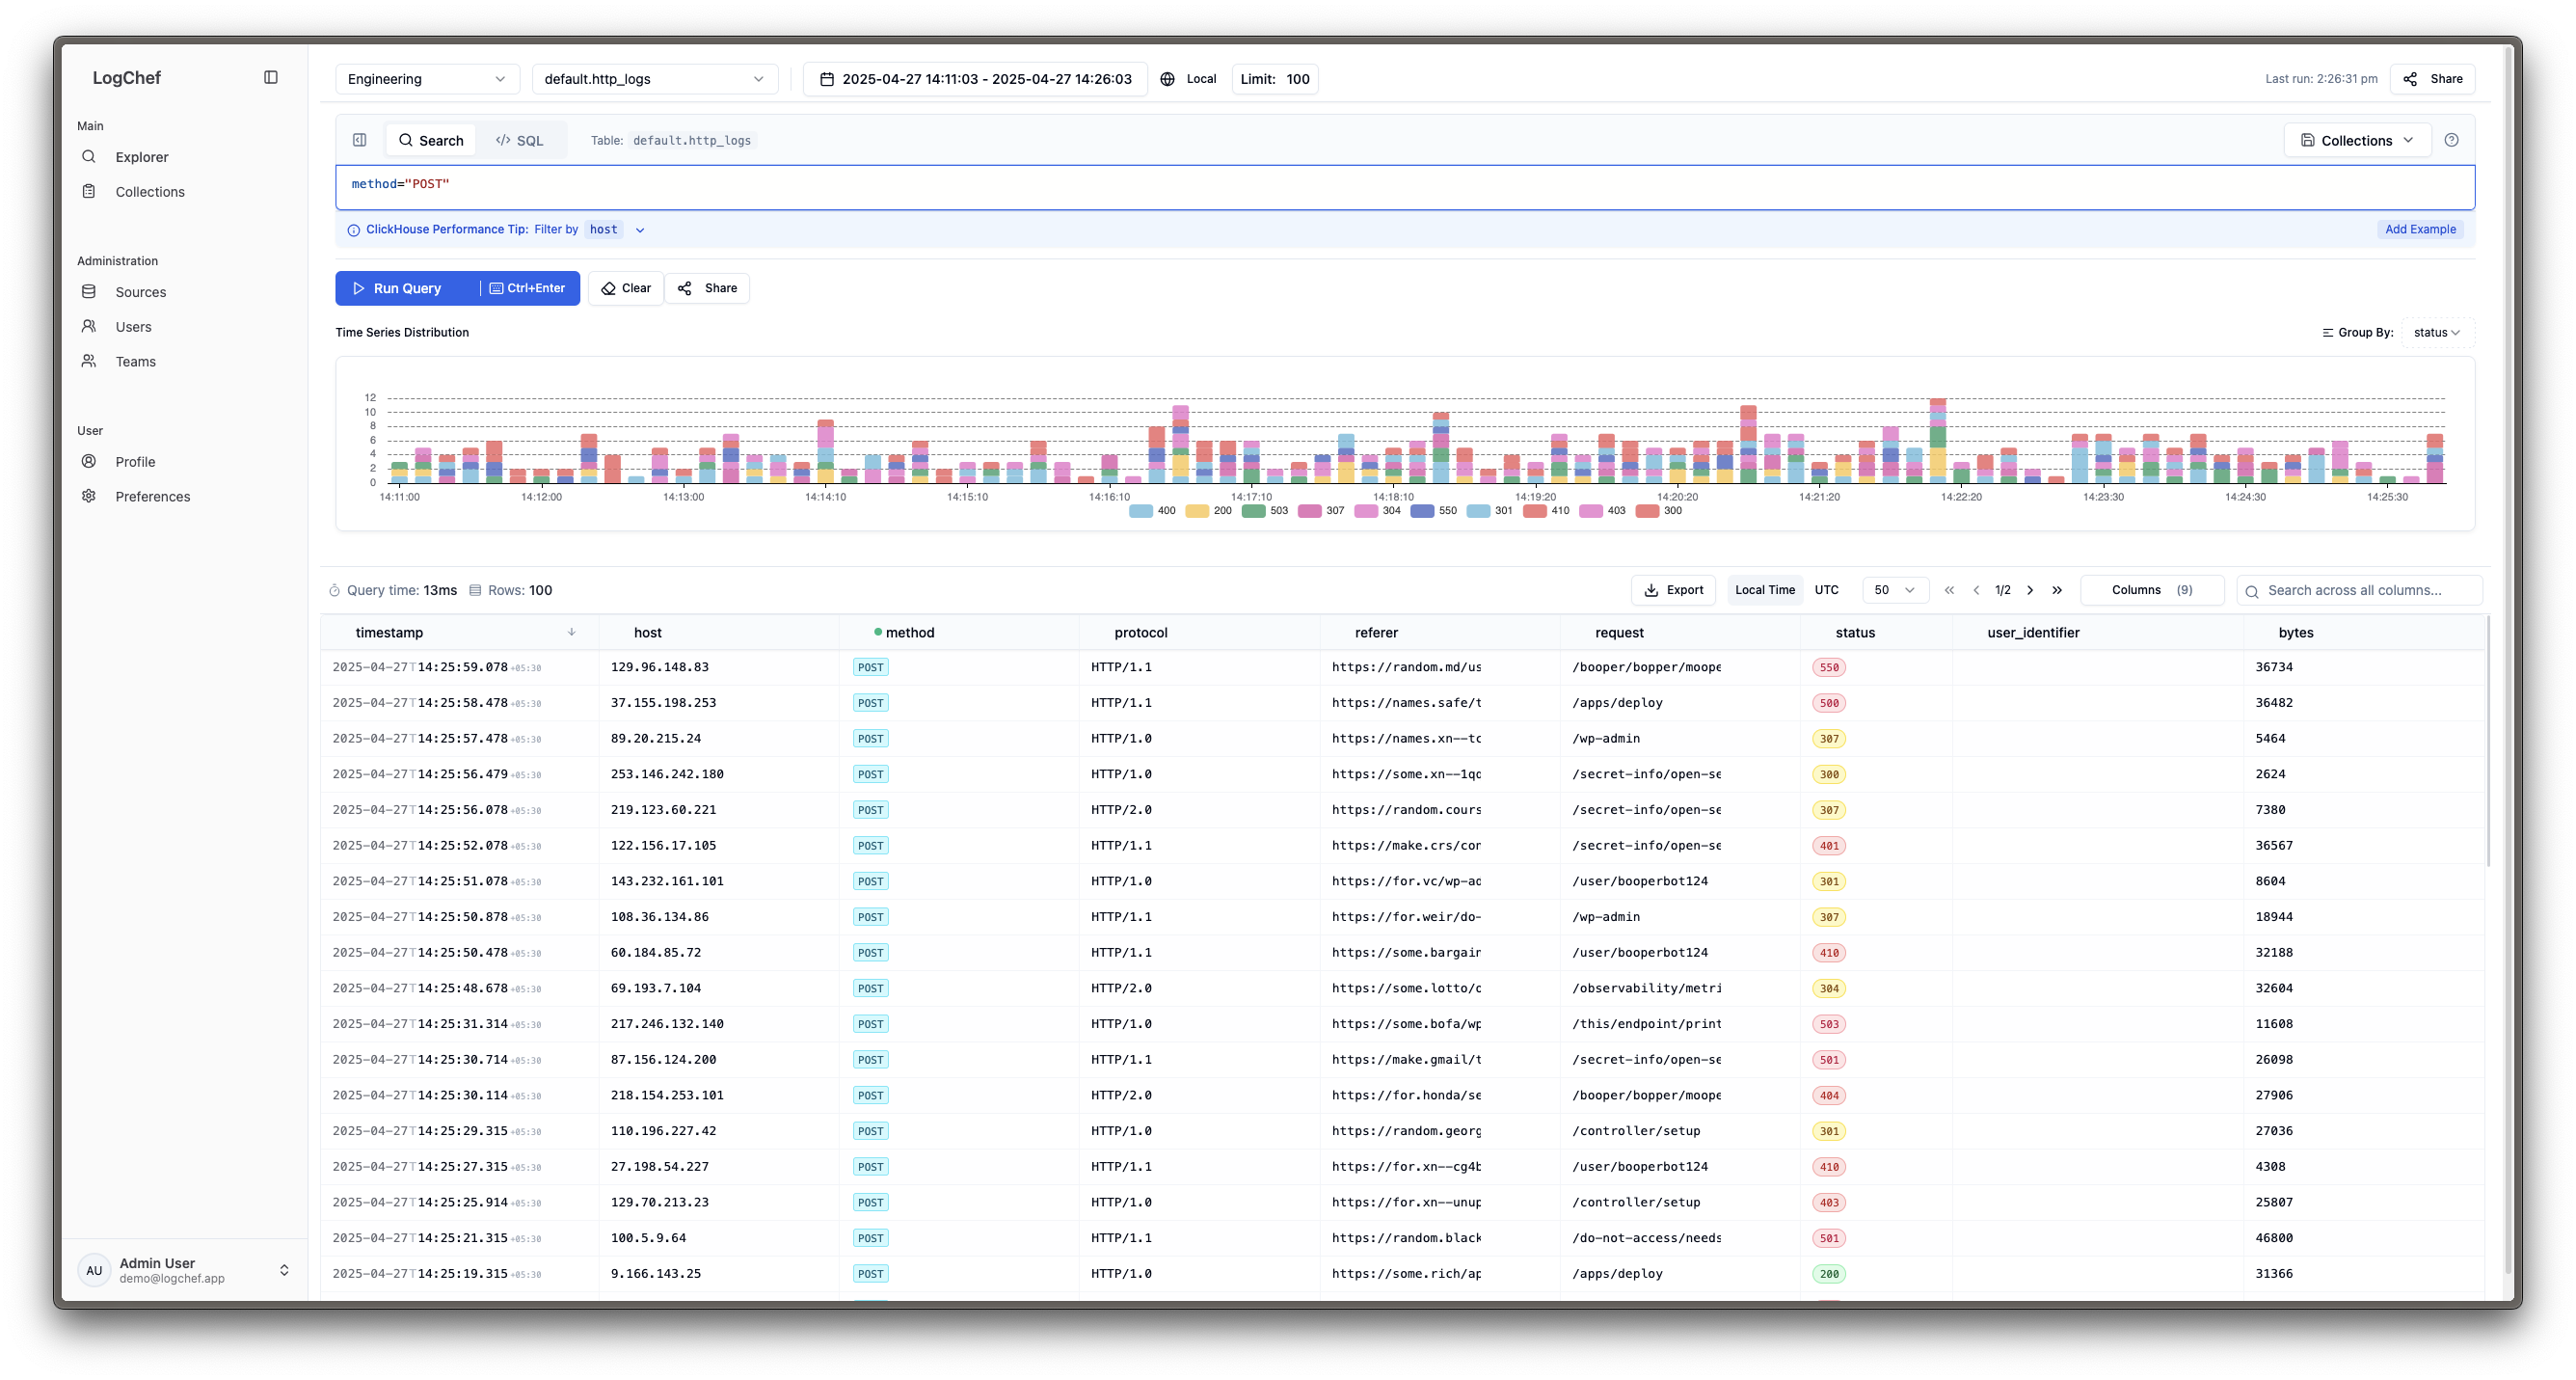
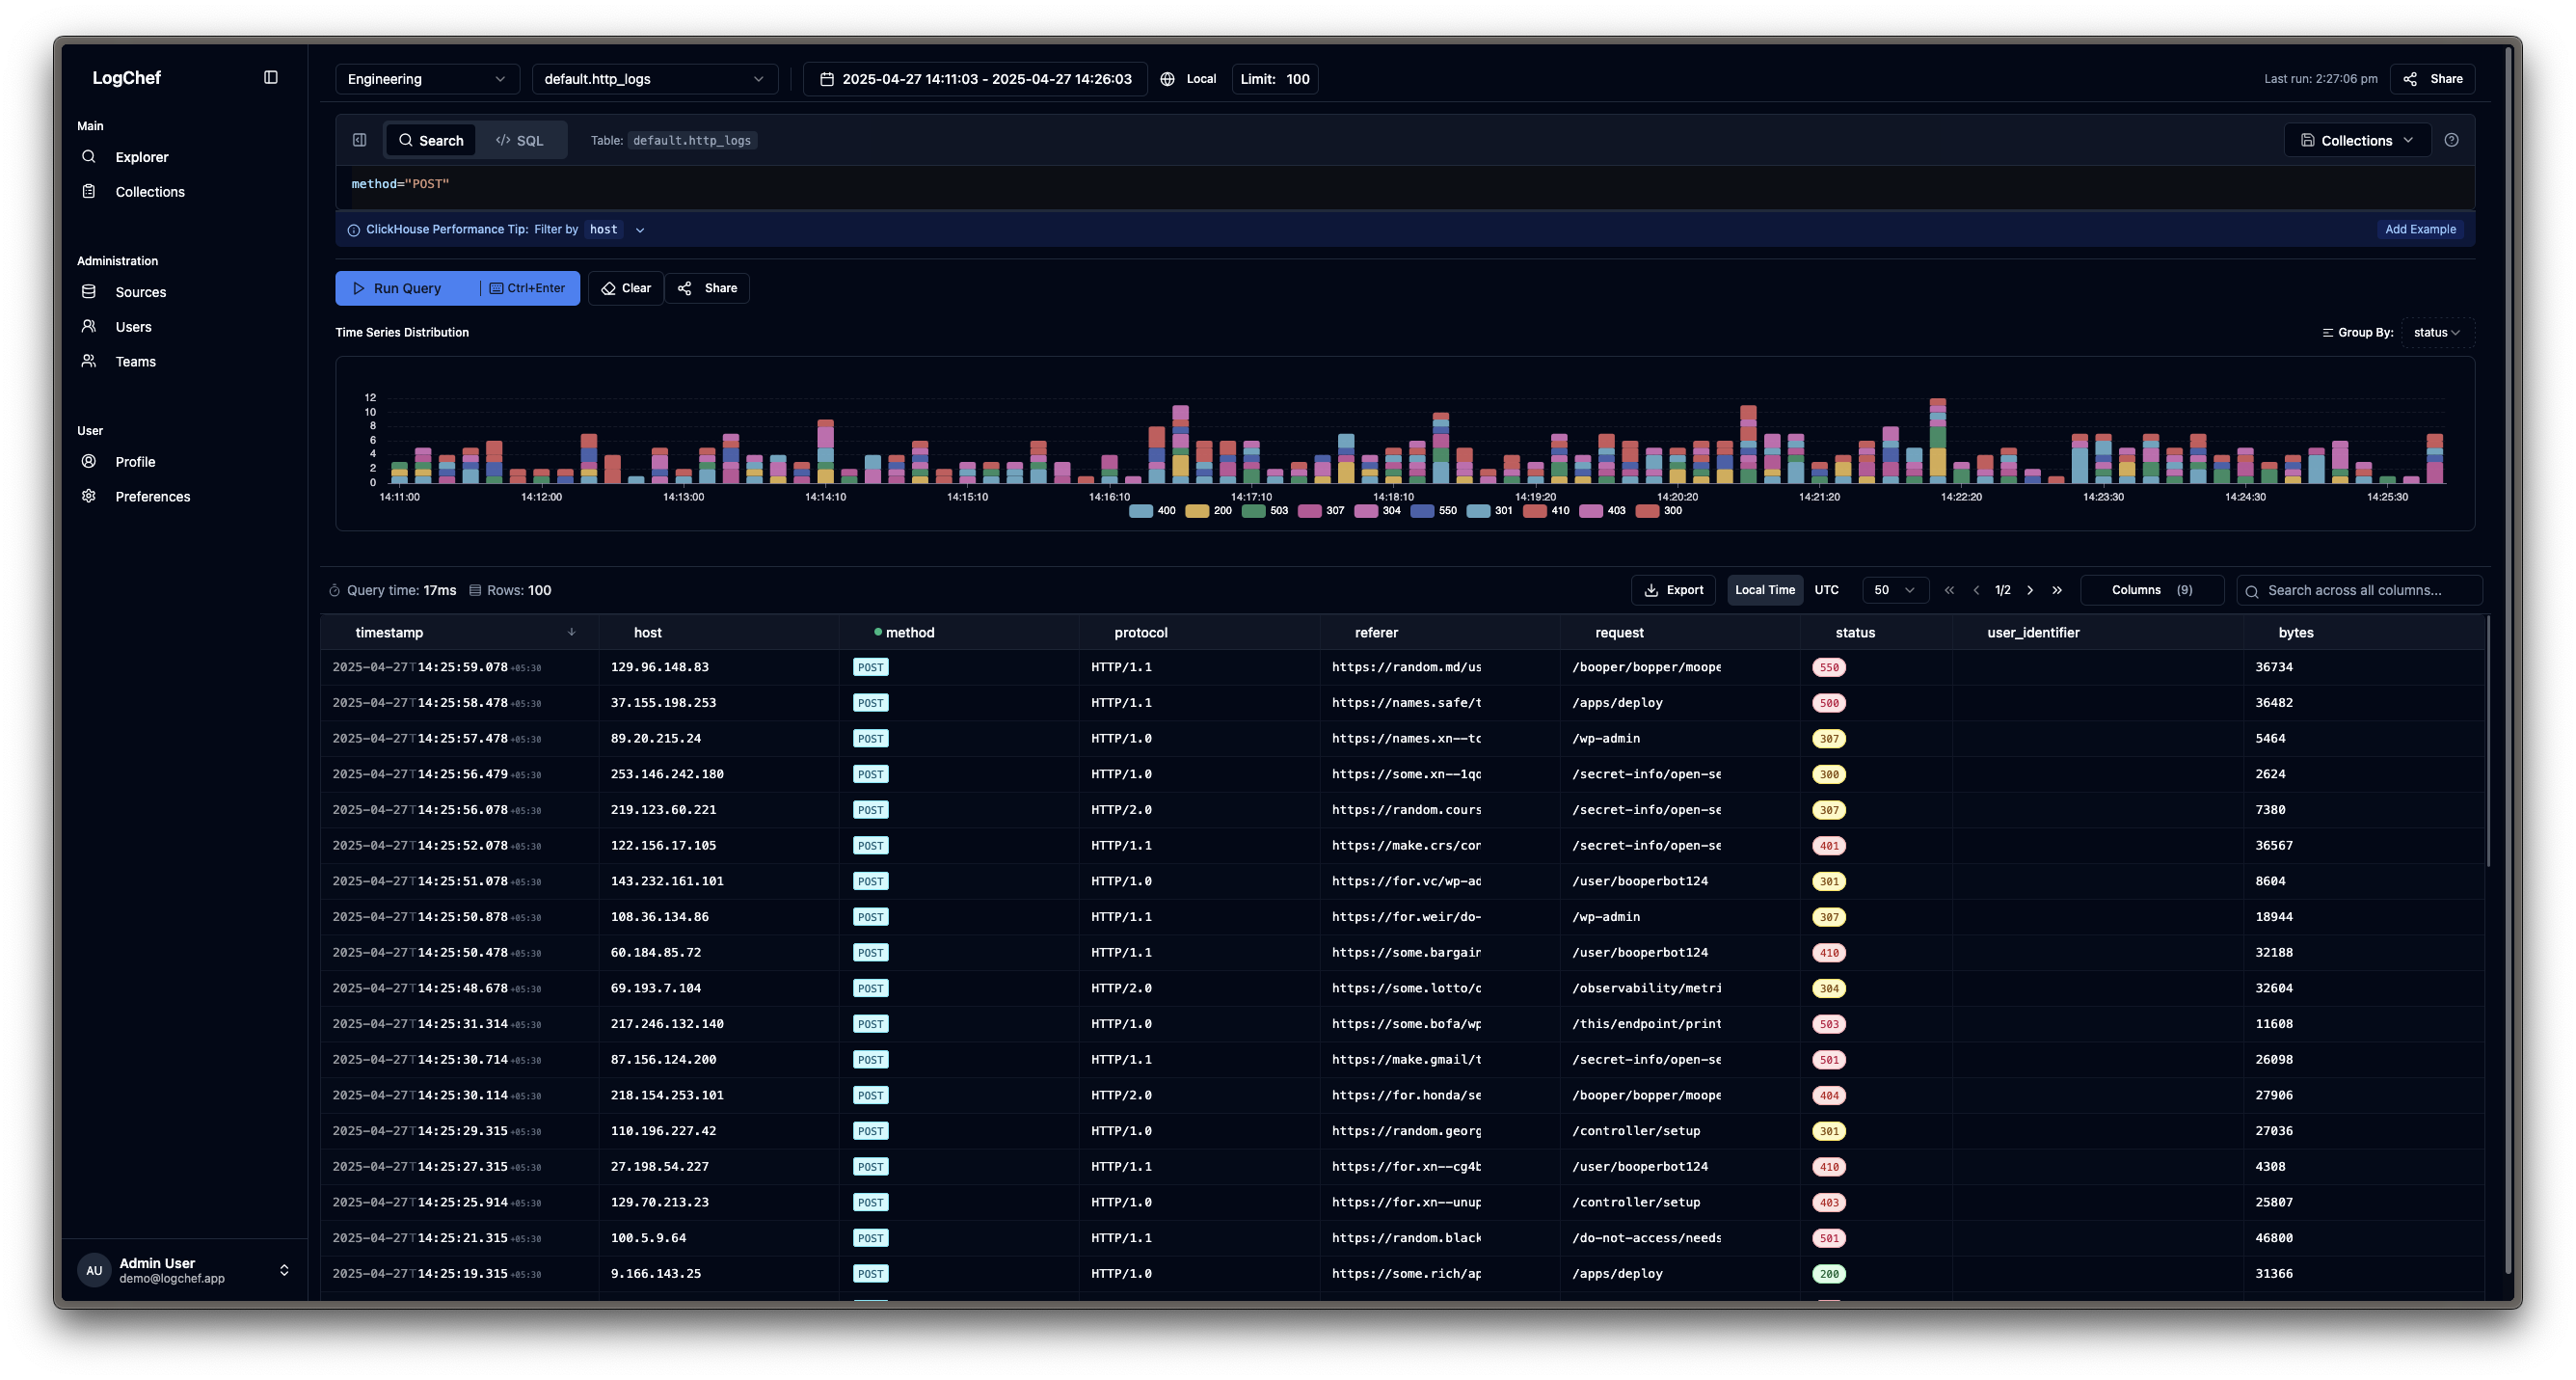
Logchef#
When I first started prototyping, I kept the scope pretty tight: just build a viewer for the standard OTEL schema. OTEL’s flexible enough, but a quick chat with Kailash sparked what turned out to be a game-changing idea: make Logchef schema-agnostic. And that really became the core concept.
Basically, Logchef lets you connect it straight to your existing Clickhouse log tables, no matter their structure. All it really needs is a timestamp field (DateTime or DateTime64). Bring your own custom schemas, stick with the OTEL standard, or even adapt it to your own needs. Logchef doesn’t force you into a specific format. From what I’ve seen, not many tools offer this kind of plug-and-play flexibility with existing tables today.
Logchef is designed as a specialized query and visualization layer sitting on top of Clickhouse. Logchef intentionally excludes log collection and ingestion. Why reinvent the wheel when excellent tools like Vector, Fluentbit, Filebeat, etc., already handle this reliably? Logchef focuses purely on exploring the logs once it’s in Clickhouse.
Stack#
- Backend: Written in Go for performance and concurrency.
- Metadata Storage: Uses SQLite for lightweight management of users, teams, Clickhouse source connections, and query collections. It’s simple and perfectly suited for this kind of a metadata store.
- Frontend: An interactive log viewer with Vue.js and styled with shadcn/ui and Tailwind CSS. I also implemented a simple search syntax for common filtering tasks (e.g.,
status=200 and path~"/api/"). This involved writing a tokenizer and parser that translates this syntax into efficient ClickHouse SQL conditions optimised for querying logs. Building this parser, validator, and integrating it smoothly with the Monaco editor for syntax highlighting was a significant effort but quite happy with the end result.
Setting Up the Public Demo (demo.logchef.app)#
I wanted a public demo instance so people could try Logchef easily. Setting this up involved a few specific tweaks compared to a standard deployment, all managed within the Docker Compose setup:
-
Generating Dummy Data: A log viewer isn’t much use without logs! Instead of ingesting real data, I configured
vectorusing itsdemo_logssource type. This continuously generates realistic-looking syslog and HTTP access logs and pushes them into the demo Clickhouse instance (syslogsandhttp_logstables). It gives users immediate data to query without any setup on their part.# vector.toml snippet [sources.generate_syslog] type = "demo_logs" format = "syslog" interval = 0.3 # Generate logs frequently [sinks.clickhouse_syslog] # ... config to send to Clickhouse ... table = "syslogs" -
Securing Admin Endpoints (Demo Mode): Since this is a public, shared instance, I wanted to prevent users from making potentially disruptive changes via the API (like deleting sources or teams). I used
Caddyas the reverse proxy and configured it to intercept requests to admin-specific API routes (like/api/v1/admin/*) and block any method other thanGET. If someone tries aPOST,PUT, orDELETEto these endpoints, Caddy returns a403 Forbiddendirectly. This keeps the demo environment stable.Caddyfile snippet (conceptual) handle /api/v1/admin/* { @block_methods method POST PUT DELETE PATCH respond @block_methods `{"error":"Operation not permitted in demo mode"}` 403 reverse_proxy logchef:8125 # Forward GET requests } -
Improving Demo Login UX: Logchef uses OIDC for authentication. For the demo, I’m running
Dexas the OIDC provider. To make it completely frictionless for users, I didn’t want them needing to sign up or guess credentials. I simply customized Dex’s theme template for the login page to explicitly display the static demo username ([email protected]) and password (password) right there. It’s a small UX tweak (again, thanks to Kailash for the idea!), but it means anyone landing on the demo can log in instantly.<!-- Dex login template snippet --> <div class="dex-info-box"> <strong>Demo Credentials:</strong><br> Username: <code>[email protected]</code><br> Password: <code>password</code> </div> <input ... value="[email protected]" .../> <input ... type="password" value="password" .../>
What’s Next?#
Logchef is already being used internally, but the journey towards a full v1.0 release continues this year. The roadmap includes exciting additions like:
- Alerting: Trigger notifications based on query results.
- Live Tail Logs: Stream logs in real-time.
- Enhanced Dashboarding: More powerful visualization capabilities.
Logchef is open source (AGPLv3), and community involvement is welcomed. You can check out the Demo or view the code on GitHub.
If you have more ideas or features you’d like to see, please reach out on GitHub or email me! I’m always open to suggestions and feedback.
Honestly, building Logchef has been incredibly rewarding. It started as a way to fix something that bugged me (and others!), and seeing it turn into a tool I’m genuinely excited about feels great.
I couldn’t have done it alone, though. I’m really grateful to my friends and colleagues who jumped in with feedback along the way. Huge thanks to Kailash for the constant support and encouragement, and to Vivek, Sarat, and Rohan for testing the early builds and offering great suggestions.
Finally, a big thank you to my wife, who patiently endured my late-night coding sessions. Her support means the world to me <3
Fin!