You know those budget freaks? People who log and categorise every Rupee they’ve spent over the month? The financially sane people? I am definitely not one and I suck at it.
I moved cities a couple of months back and had some big ticket spends off late, mostly financed by credit card. I wanted an easy way to list down where all I’ve spent most money and spot some recurring expenses so I can be better prepared for them from next month. I’ve found that broadly keeping an idea of things where you spend money works for me (v/s the two extremes - completely blind or logging every small transactions). Of course I know people who make budgeting a habit but I only wish I was consistent enough to do that.
Anyway, I downloaded the statement in CSV format from my bank.
Initially I thought I’d use some simple Excel to make sense of this but I realised how bad my Excel skills really are. I got an idea to dump the CSV file to ChatGPT (yay privacy) and ask questions. It kinda sucked at it and gave wrong answers for a lot of questions and also started to hallucinate data which wasn’t even present in the CSV.
The next most obvious step would be to write a simple script and parse it. I wanted to experiment if ChatGPT could do this entire exercise of writing the script and the relevant code for the analysis I wanted to perform.
Here’s the initial prompt I gave:
I am pasting a CSV file which also includes the first row as header. Write Python code to parse this:

,,Transaction Date,Details,,,Amount (INR),,,Reference Number,,
,,27/04/2023,"Blinkit, BANGALORE, IN",,,290.00 Dr.,,,7477468633,,
... other data ...
It returned the following code:
import pandas as pd
from io import StringIO

csv_data = """\
,,Transaction Date,Details,,,Amount (INR),,,Reference Number,,
,,27/04/2023,"Blinkit, BANGALORE, IN",,,290.00 Dr.,,,747746xxxx,,
# ... (the rest of your CSV data)
,,03/04/2023,"DIGITAL LOUNGE, GURGAON, IN",,,799.00 Dr.,,,738201xxx,,"""

# Read the CSV data into a pandas DataFrame
data = StringIO(csv_data)
df = pd.read_csv(data, header=1)

# Clean up the DataFrame (remove unnecessary columns)
df = df.dropna(axis=1, how="all")

# Rename columns
df.columns = [
    "Transaction Date",
    "Details",
    "Amount (INR)",
    "Reference Number"
]

print(df)
Looking at this, I was a bit impressed as it figured the CSV contains some useless empty columns and it removed (without me giving any information about it).
I also asked it to modify the code to read the file locally from disk and it swapped StringIO with the path to CSV file:
# Provide the file path to your local CSV file
file_path = "your_file.csv"

# Read the CSV data into a pandas DataFrame
df = pd.read_csv(file_path, header=1)

Next, I prompted to do some analysis on it:
Write some more code to do the analysis to answer these questions:

- How many total debit and credit entries
- What is the total amount of debits and total amount of credits
- Which vendor have I spent the most?
- How much have I spent on `SWIGGY` ?
It returned some one-liners to answer each question:
# Filter debit and credit entries
debit_entries = df[df["Amount (INR)"] > 0]
credit_entries = df[df["Amount (INR)"] < 0]

# Count the total number of debit and credit entries
total_debit_entries = len(debit_entries)
total_credit_entries = len(credit_entries)

# Calculate the total amount of debits and credits
total_debit_amount = debit_entries["Amount (INR)"].sum()
total_credit_amount = credit_entries["Amount (INR)"].sum()

# Find the vendor with the most spending
most_spent_vendor = debit_entries.groupby("Details")["Amount (INR)"].sum().idxmin()

# Calculate the total amount spent on SWIGGY
swiggy_spending = debit_entries[debit_entries["Details"].str.contains("SWIGGY", case=False)]["Amount (INR)"].sum()

# Calculate the total amount spent on AMAZON RECHARGES
amazon_recharges_spending = debit_entries[debit_entries["Details"].str.contains("AMAZON RECHARGES", case=False)]["Amount (INR)"].sum()

# Print the results
print(f"Total debit entries: {total_debit_entries}")
print(f"Total credit entries: {total_credit_entries}")

print(f"Total debit amount: {total_debit_amount}")
print(f"Total credit amount: {total_credit_amount}")

print(f"Vendor with the most spending: {most_spent_vendor}")

print(f"Total amount spent on SWIGGY: {swiggy_spending}")
At this point, I know that this will fail because we’ve not cleaned up the data. The column Amount (INR) needs cleaning up. I prompted ChatGPT to write a function to clean this column:
The amount column as `21,620.54 Dr.` to represent that Rs 21,620.54 is debited. And `73,500.00 Cr.` to represent that Rs 73,500.00 is credited. Can you write a function to apply this transformation on the `Amount (INR)` column?
It responded with:
# Clean up the data
def clean_amount(value):
    if ' Cr.' in value:
        value = value.replace(' Cr.', '')
        return -float(value.replace(',', ''))
    elif ' Dr.' in value:
        value = value.replace(' Dr.', '')
        return float(value.replace(',', ''))

df["Amount (INR)"] = df["Amount (INR)"].apply(clean_amount)

# Now proceed with the analysis code
Perfect! After transforming the amounts, I ran the analysis code:

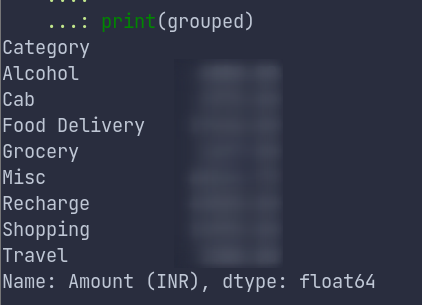
The next prompt I gave was to analyse the spending in various categories.
In the above CSV file can you guess the categories of each merchant based on the `Details`? And write the code for grouping the spends on various categories. If you're unable to figure out the category for the transaction, you can use a "Misc" column to bucket them.
It actually did an okayish job at this and ignored a lot of vendors which I think it could have guessed easily:
def categorize(details):
    details = details.lower()
    if "swiggy" in details:
        return "Food Delivery"
    elif "amazon recharges" in details:
        return "Recharge"
    elif "uber" in details or "ola" in details:
        return "Cab"
    elif "zomato" in details:
        return "Food Delivery"
    elif "netflix" in details or "prime video" in details:
        return "Streaming"
    else:
        return "Misc"

# Create a new column called "Category" by applying the categorize function to the "Details" column
df["Category"] = df["Details"].apply(categorize)

# Group the transactions by category and calculate the total amount spent in each category
grouped = df[df["Amount (INR)"] > 0].groupby("Category")["Amount (INR)"].sum()

print(grouped)
I decided to give some manual inputs to it to refine the function.
I can help you with categorising it further.
`Blink` -  Grocery
`Indigo` - Travel
`PEGS` - Alcohol
`Nike` - Shopping

Also note that the cateorgy name matching should be case-insensitive.
And it modified the Python snippet to add these rules.

Mixed reactions looking at this. Happy that I could practically get exactly the result I had in mind in just 10 minutes without writing any code. Sad because damn I need to limit those empty calories from next month (famous last words).
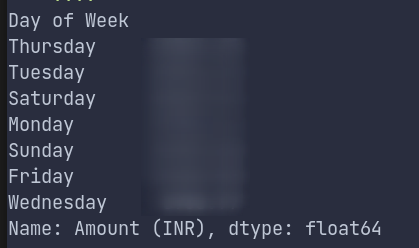
Next, I wanted to see if my spends on weekends are higher or not. (I don’t expect them to be, but you never know).
Prompt:
Can you also write the code to figure how much spends I've done grouped by the day of week?
Response:
# Convert the 'Transaction Date' column to a datetime format
df['Transaction Date'] = pd.to_datetime(df['Transaction Date'])

# Create a new column called "Day of Week" containing the day of the week for each transaction
df['Day of Week'] = df['Transaction Date'].dt.day_name()

# Group the transactions by the "Day of Week" and calculate the total amount spent on each day of the week
grouped_by_day = df[df["Amount (INR)"] > 0].groupby('Day of Week')['Amount (INR)'].sum().abs()

# Sort the grouped data by the total amount spent in descending order
sorted_grouped_by_day = grouped_by_day.sort_values(ascending=False)

print(sorted_grouped_by_day)

It was a fun 10-15 min exercise to figure out my spending habits based on the last month’s statement. I intend to do this for the next couple of months and then it would make sense to write more queries which would show trend-lines of spends in various categories over time.
Honestly, I just loved how ChatGPT made this task so seemingly simple. It’s not that I can’t myself write the code for these kind of simple analysis. It’s the sheer power at your hand to go from ideation phase to answer within seconds. And I think that’s why I love it so much. I didn’t have to go through Pandas docs (because I don’t use that in my day job so it’s quite normal to not know various syntax/functions that I could use) and I’d grok through different StackOverflow questions to achieve what I wanted to. And maybe imagining all this resistance on a Sunday morning would have meant that I never got to write the script in the first place.
Fin!